Exhaustive test of the difference method up to x = 29, k = 46

I posted some rushed Python calculations in another thread earlier, but now I’ve taken the time to think about the best way to test the difference method (the cycle elimination strategy from this thread which has been a central focus on the forum), and ran optimized code in C written by Claude to run as many calculations as I could.

I’m using the terminology and variable choice from the linked thread, which is essentially:
v - the “parity vector”, which is a binary string where 1 represents a \cfrac{3n+1}{2} step and 0 represents an \cfrac{n}{2} step.
\beta(v) - the parity summation applied to v
x - the number of odd steps in v
k - the total length of v

The program generates the irreducible rotationally unique vectors for each value of x, where k=ceil(x*log_2(3)), and for each v, calculates the magnitude of the difference between each pair of rotations, divides out all factors of 2 and 3 from these results, then finds the smallest one. Once it has found the smallest one for each v of that length, it then finds the largest of all of those. This is what I will refer to as the MMRBD (maximum minimum reduced beta difference). This represents the absolute worst case scenario for the difference method for each vector length, which makes it the limit for a generalized bound for ruling out cycles derived from this particular method (combining two beta values each with a coefficient of 1).

Here is the program output. Each five line chunk is the results for one vector length. The vector shown is the one that resulted in the MMRBD, rotated to its minimal position for uniformity (the minimal position being the rotation corresponding to the smallest beta). Two lines are placed in each vector to denote the two rotations that give the minimum reduced beta difference for that vector. For example, 11|011|00 means one of those rotations is 0110011 and the other rotation is 0011011. The last line, “greater than denominator”, counts how many vectors have a minimum reduced beta difference greater than 2^k-3^x and cannot therefore be ruled out as an integer cycle, and after the slash is the total number of irreducible rotationally unique vectors of that length.

x = 1, k = 2
MMRBD: 1
|1|0
denominator: 1
greater than denominator: 0/1

x = 2, k = 4
MMRBD: 1
1|1|00
denominator: 7
greater than denominator: 0/1

x = 3, k = 5
MMRBD: 1
11|1|00
denominator: 5
greater than denominator: 0/2

x = 4, k = 7
MMRBD: 5
11|011|00
denominator: 47
greater than denominator: 0/5

x = 5, k = 8
MMRBD: 7
1111|1|000
denominator: 13
greater than denominator: 0/7

x = 6, k = 10
MMRBD: 67
1|1110100|10
denominator: 295
greater than denominator: 0/20

x = 7, k = 12
MMRBD: 131
11|011110100|0
denominator: 1909
greater than denominator: 0/66

x = 8, k = 13
MMRBD: 413
|11011|11010100
denominator: 1631
greater than denominator: 0/99

x = 9, k = 15
MMRBD: 1447
11011|111011|0000
denominator: 13085
greater than denominator: 0/333
vectors tied for largest: 1

x = 10, k = 16
MMRBD: 3113
1|11101110100|1010
denominator: 6487
greater than denominator: 0/497

x = 11, k = 18
MMRBD: 14437
110|1|11110101110000
denominator: 84997
greater than denominator: 0/1768

x = 12, k = 20
MMRBD: 47239
1101|11110101100|10100
denominator: 517135
greater than denominator: 0/6288

x = 13, k = 21
MMRBD: 93161
111|01111101101010100|0
denominator: 502829
greater than denominator: 0/9690

x = 14, k = 23
MMRBD: 438943
|110111|11011010111000100
denominator: 3605639
greater than denominator: 0/35530

x = 15, k = 24
MMRBD: 924751
111110111101001010|01101|0
denominator: 2428309
greater than denominator: 0/54477

x = 16, k = 26
MMRBD: 3314077
1|1110|111010111111010001000
denominator: 24062143
greater than denominator: 0/204248

x = 17, k = 27
MMRBD: 7902995
111|1011111101100011010010|10
denominator: 5077565
greater than denominator: 334/312455

x = 18, k = 29
MMRBD: 26525755
111|0111110101111011010001100|0
denominator: 149450423
greater than denominator: 0/1193010

x = 19, k = 31
MMRBD: 118535341
|110111|1101101011110101101000100
denominator: 985222181
greater than denominator: 0/4552275

x = 20, k = 32
MMRBD: 243501565
11111011111101000101011010|01101|0
denominator: 808182895
greater than denominator: 0/7055776

x = 21, k = 34
MMRBD: 873236051
1111|01111110101110100101010110100|0
denominator: 6719515981
greater than denominator: 0/27293640

x = 22, k = 35
MMRBD: 1735810211
|1|1111011110101101110110101110000010
denominator: 2978678759
greater than denominator: 0/42181080

x = 23, k = 37
MMRBD: 7459818685
1101|1111010|11110110111010101000110100
denominator: 43295774645
greater than denominator: 0/165056400

x = 24, k = 39
MMRBD: 30769015709
1|10111110110|101111110101100110100010100
denominator: 267326277407
greater than denominator: 0/644636907

x = 25, k = 40
MMRBD: 66958939751
11|101111010111111011001101010101101000|10
denominator: 252223018333
greater than denominator: 0/1005633625

x = 26, k = 42
MMRBD: 230064011941
1|1110|1110101111110101101110110101010001000
denominator: 1856180682775
greater than denominator: 0/3964512336

x = 27, k = 43
MMRBD: 558697669033
1111|1011111110100011011101101010110000110|10
denominator: 1170495537221
greater than denominator: 0/6167026726

x = 28, k = 45
MMRBD: 1898355558433
1111|0111111011001011101011111010100010110100|0
denominator: 12307579633871
greater than denominator: 0/24512635642

x = 29, k = 46
MMRBD: 4945653403507
111|10111111010101011101101111010001011010010|10
denominator: 1738366812781
greater than denominator: 33504124/38036848410

I had the program check if a given vector length had more than one vector that shared the MMRBD, and this was only the case for x = 3, 4, and 5, each of which had a two-way tie. I also ran the program a second time just for a couple minutes and had it record the top eight MMRBD and their vectors. They seem to typically be all more than 0.9 times the highest one. I can share this output if anyone’s interested.

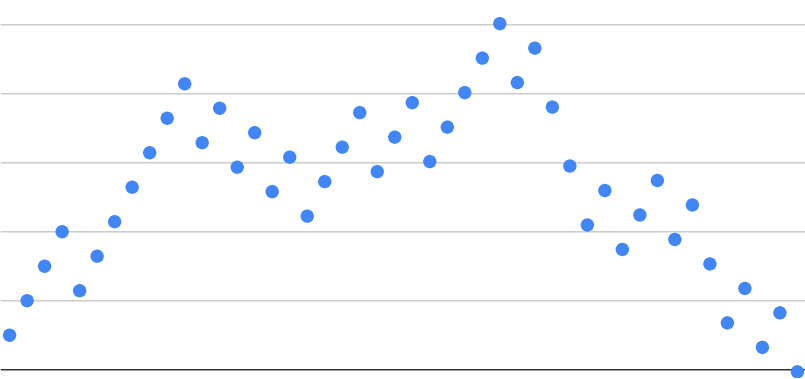
Here is my quick analysis on the MMRBD trend. This is where the more advanced math around determining a general bound comes in and I would like to leave that for someone else, but I made a plot which shows that the ratio between MMRBD and 3^x seems to hover between 0.05 and 0.1 for this range with a slightly increasing trend. This explains why two of the vector lengths (at x = 17 and x = 29) have an MMRBD greater than the denominator. Those two denominators are only 3.9% and 2.5% of 3^x respectively.

Edit: Note that I excluded x = 1, 2, and 3 from the plot since they seem to be outliers from being so small, and including them zooms the plot out unnecessarily.
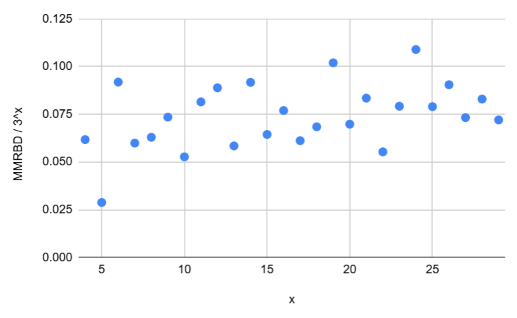
Here are the raw MMRBD values if anyone wants to do their own analysis on them:

1, 1, 1, 5, 7, 67, 131, 413, 1447, 3113, 14437, 47239, 93161, 438943, 924751, 3314077, 7902995, 26525755, 118535341, 243501565, 873236051, 1735810211, 7459818685, 30769015709, 66958939751, 230064011941, 558697669033, 1898355558433, 4945653403507

The program runtime was around 7 hours. I would run it again if there are suggestions for changes to make, or I can paste the code. Each new x increases the runtime by 2-3 times. Shortcuts could definitely be made but I wanted to start as exhaustive as possible. I did take one big shortcut already which is k=ceil(x*log_2(3)) and I believe it’s a completely reasonable restriction but it’s worth emphasizing.

1 Like

I have some comments:

Here, you mean “cannot be ruled out”, right?

I also made similar calculations and agree that this method can rule out all parity vectors for most k values. Interesting results and impressing that you could handle all vectors in the case x=29
, k=46.

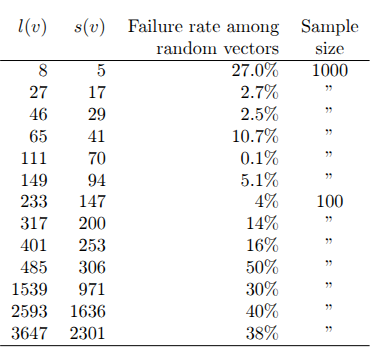
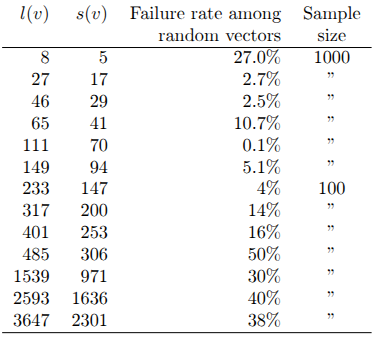
@AcidicJello , I agree with @oros that exhaustive testing is impressive. In the past, I only did some sampling to estimate what percentage of vectors cannot be ruled out by two-member subtraction. Here are the hard cases, where \delta is small.

Up to s(v) < 100, any row absent from the chart got 0% failures under sampling.

It’s unclear where this is going asymptotically.

@oros @mathkook Yes that should have been “cannot”. Fixed. I can’t take any credit for the efficiency of the code since I didn’t write any of it but it was my goal to make this as fast as possible. In addition to C being like 10 to 100x faster than Python, I ran my laptop on a brand new SSD with nothing on it but Linux. This run went up to the 64-bit limit but there’s a 128-bit version ready to go if I want to put new thermal paste on the CPU and let it run for a few days.

Assuming \delta / 3^x is randomly distrubuted between 0 and 1, this data suggests the method rules out all vectors for around 92% of k values, since MMRBD hovers around 8% of 3^x. However the slope of the plot suggests that might increase beyond 8% in some way. Your table shows a lot higher failure rate than mine. I had it try all combinations regardless of LRS (some of the MMRBD are from rotations that don’t have the LRS as the prefix) and I factored out powers of 3 in addition to powers of 2. Not sure if you did the same but that could be why.

I was particularly interested in looking at the structure of the vectors associated with the MMRBD. It seems hard to determine what’s special about them, other than having a small LRS. They look like they have one clear section of general increasing and one of general decreasing. This may help against having a lot of the cycle members in the same neighborhood and minimizing the chance of some pair being close together.

Much more data could be had by giving up on the exhaustive part.

Yep, my failure rates are higher mainly because I only show the hard cases, but on apples-to-apples cases like k=27, probably I only cancel 2s (not 3s), like you guess.

For lots of random vectors at (say) k=65, it might be interesting to build a classifier to guess whether the min difference of a vector is above or below delta. Or a regressor that guesses the min difference. See if it finds something beyond LRS length.

Sorry about the forum downtime!

I run the forum off the laptop in my house … and when I decided to build the neural-network classifier mentioned in the previous post above … the laptop’s GPU engaged and there was a loud pop. Capacitor blown. I have a new motherboard, so I can do the non-GPU functions (like this forum), though I need to get the GPU replaced. If you can’t reach the forum in the near future, it’s probably a similar repair issue, regrets in advance!

I back up the forum to Dropbox every day just in case, so nothing will be lost.

1 Like

Ok, GPU and motherboard both replaced :slight_smile: Thank you default three-year warranty.
Consider vectors with l=65, s=41. Overall, the difference method rules out about 89% of vectors. (My version only cancels factors of 2 after subtraction, not factors of 3.)

Can we build a classifier that does better than 89% accuracy? To do that, we’re interested in identifying the vectors that are NOT ruled out. Do they have something in common?

  1. Divide randomly-generated vectors into train (490k), dev (10k), and test (20k). Label each according to whether the difference method rules it out.

Train gold labels: 89.27% ruled out.
Dev gold labels: 89.18% ruled out.
Test gold labels: 89.42% ruled out.

  1. Notice that vectors NOT ruled out almost always have have short LRS. But that’s not enough to identify them … because even if a vector has a short LRS, it’s still probably ruled out.
LRS length share of vectors ruled out
7 0.06% 63%
8 3.4% 72%
9 16.4% 79%
10 24.8% 86%
11 22.0% 91%
12 14.6% 95%
13 8.7% 98%
14 4.7% 99.4%
15 2.6% 99.8%
16–17 2.1% 99.96%
18+ … …
  1. Run transformer learning on the train set. This learns to predict P(v), the probability that a vector will have the label “ruled out”. Note that the transformer isn’t given any hand-built features such as LRS length.

After 40 epochs, all P(v) > 50\%. So the system always guesses “ruled out” and is therefore right 89.42% of the time on the test set. Can we do better?

  1. After 160 epochs, some P(v) < 50\%. The overall test set accuracy is 89.64%, which is slightly higher than “always guess ruled out” (89.42%). It rarely guesses “not ruled out”, but when it does, it’s right 58% of the time.

  2. After 279 epochs, 90.06% on test. Here are test vectors that the transformer (correctly) strongly suspects can’t be ruled out.

vector 1-P(v) LRS best diff/delta
11101110000100010001101111101101111111101111110110011011100011010 0.781 9 1.99
00000100011111011111110101111111110110111001011110000110100101111 0.781 13 3.31
01010110110000000100111110110111111010111111111100101111011001101 0.766 9 1.68
00100011010110101001111110111111110100111110011111011001011001110 0.757 10 1.42
01101101100101111101101010011010010101000001111101111110011111111 0.756 10 3.36
10101111101010110011111001010100011110000101001011111011101111111 0.755 10 1.82
10001011010100101110111111011011111111110100111101101001001100101 0.754 9 1.91
01100111110101101001110101100011100110101001110001011111011111111 0.745 9 2.44
11010010000011011110011111110111111111101010110110010011011101001 0.724 9 2.04
01111110011111111101011011111001001010001001001001101100101111111 0.720 9 1.32
01010110111111011110101111111110001110011100101001101110101001001 0.720 8 2.23
01111111100110110111111111000100011011011000101010010111000111111 0.718 11 1.93
11001010100111110111111110111010111000111011110001100110101110100 0.717 9 2.20
11011111000110100111000110101101100000110001111110110111111110111 0.714 12 1.78
11010111011010000010010101010111111011111110101101011111011011100 0.710 9 1.01
11101011011110011101100000101110010001010011101111001111110111111 0.707 12 4.12
11110011011111001111101101111101001011001100110000100010111110111 0.706 10 2.58
11111110110111010110101111010100101100001100100010111111010111101 0.706 11 2.21
01011010111111010010110100110001001100110001111011110110111111111 0.692 9 1.73
00110101010111111101111111110010111101001011001110010100101101101 0.690 10 1.26
00111001000011011001101111110111100111111110110101110111000110101 0.690 9 3.65
01111111110100011101111011010111000100100111000001101111111001111 0.688 10 1.36
10110111111000101010111110100011010001000111110111111110011011110 0.687 9 1.75
11111001111111111001010100100111101111100001100010101001011111011 0.685 11 2.42
01111111011111111110011111101100010100110011110011000100011010110 0.684 10 1.28
  1. What do they have in common?

Take height to be the ratio between the largest rational member and the smallest. These strings have larger on-average heights (2^9, versus about 2^7). They also have larger on-average median members (about 2^{12}, versus about 2^{11}).

It makes sense: if members are generally bigger, then their difference will be generally bigger, which means you have to cancel more 2s.

I’m not sure how the transformer locates these concepts from the (labeled) bit strings alone, or what other concepts it might be locating.

Suppose we give three features to a gradient boosting ML algorithm: LRS size, median member size, and number of runs of six 1s. Then we already get 89.68% accuracy, versus 89.42% for majority class. The transformer is doing better, because it’s finding other stuff. If it could achieve a high accuracy, we could probably reverse engineer it in this same way.

  1. After 360 epochs, test set accuracy is 90.18%.
1 Like

Were you able to determine the importance of average height and median member height because you could somehow see that’s what the program learned, or by looking at the vectors it rated highly?

I saw another pattern in the vectors with the highest MMRBD from looking at the shape of their orbits.


Here’s the winning orbit for k=46 (log scaled). It seems like when the trajectory picks a direction to go, it prefers to go in an orderly pattern (like ‘1111’ or ‘101010’ or ‘110110’). So maybe the ML algorithm could be selecting for some kind of orderliness like this.

Would it work better to label the vectors according to their score MMOBD(v) / 3^x? I feel like that’s a good metric because \delta seems to behave like a pseudo-random number between 1 and 3^x, so how good a vector is at not being ruled out seems to correspond with where its MMOBD(v) is on a scale from 1 to 3^x, with \delta being the cutoff set independently for each vector length.

That pattern is nuts! It seems the worst case for the difference method isn’t “go random”. More like act diabolically. Right, I didn’t look into the learned weights, just looked at the transformer’s highly-scored vectors.

Since I fixed l=65 and s=41, I guess it didn’t matter too much what I divided by, since it’s the same for all the vectors. If I picked l=485 and s=306, it’d be a more interesting 50/50 split between “ruled out” and “not ruled out”. If you want to compare vectors across different lengths, what you say makes total sense.

I’m going to let the training above continue for a while, then maybe switch over to a softer objective, like predicting the minimum 2-free \beta difference from v.

1 Like

After 760 epochs, test accuracy is 92.11% versus majority rate of 89.42%. So the transformer is able to determine, to some degree, whether the difference method will work on a vector v. At least better than random guessing.

Precision: it gets 71% accuracy on its “not ruled out” calls.
Recall: it fingers 43% of “not ruled out” vectors.
No overfitting: train/test gap is small.

Poking through the heads and weights doesn’t yield much, though.

Poking through vectors’ predicted labels (“ruled out” or “not ruled out”) turns up the same, very logical, features about median member size and the ratio of largest to smallest member. Using only features like this gives about +1% over majority baseline, so the transformer is doing more.

(This business is tricky … if the transformer were really smart, it would learn the difference method itself and predict with 100% accuracy. So, we hope it is smart but not too smart.)

In connection with the largest/smallest ratio, @oros has a nice post.

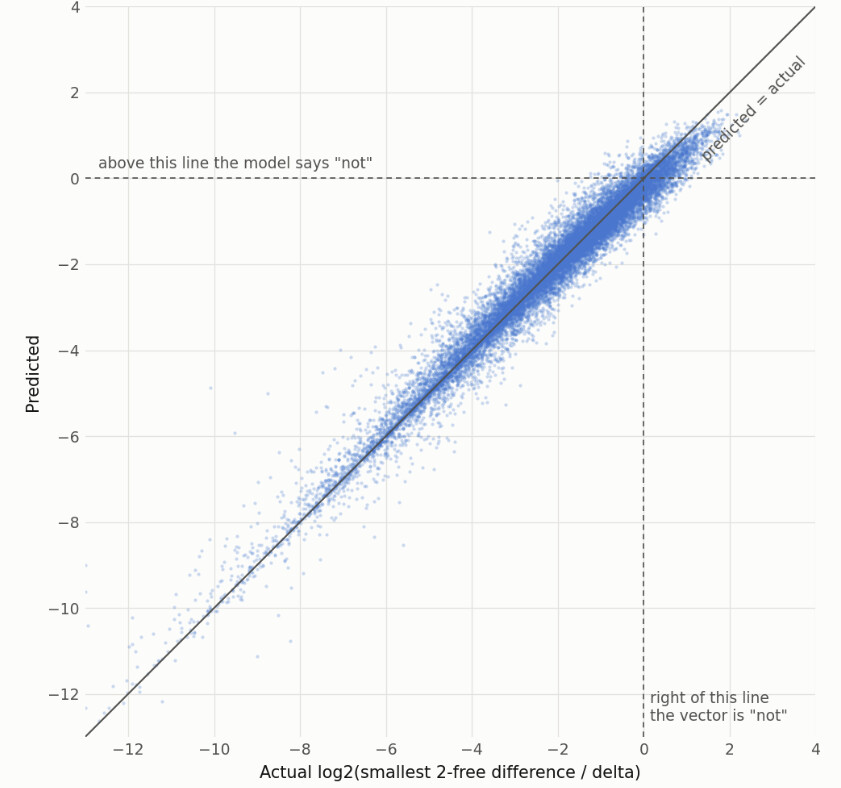
Let’s predict the “minimum 2-free beta difference over \delta” now, and make a scatterplot of actual vs. predicted.

The transformer learns to predict pretty well, with R^2 of 0.965 on test data.

Then, used as a classifier, it’s actually great. Accuracy is 95.54%, versus a majority baseline of 89.42%.

So, from labeled examples, the transformer can learn (pretty well) whether an unseen vector will be ruled out by the difference method.

A new thing it learns well is to identify two rotations whose member-difference is already small (even before 2-cancellation). This happens when the rotations are d=19 apart with k=12 ones between them, or 27 apart with 17 ones between them, or similar stuff. If you go up 12 times and down 7 times, then you’re back in your old neighborhood. The transformer seems to like vectors with such rotation pairs (though this pattern is found in its labelings, not necessarily in its weights).

Take:
m_i is the ith member
m_j is the jth member
m is the cycle member of the little block on its own
a is the shared prefix length

Then:
m_j - m_i = \cfrac{3^k}{2^d-1} (m_i - m)

If we drop m (imagining it is small relative to m_i), then the log-2-free-difference over \delta works out to be around:

\log_2 m_i + \log_2 | \cfrac{3^k}{2^d-1} | - a

This formula is 99.06% accurate at predicting “ruled out” versus “not ruled out” on the test set.

There’s not too much shocking here, I don’t think – it seems like mostly edging toward the true definition of “ruled out” by a transformer who hasn’t been told what that is.

It’s interesting, though, that we’ve previously spent more time on vectors with long LRS rather than close member pairs.

One way to combine members’ \beta values to get something lower than \delta is to subtract two members that are (1) small already, and (2) separated by a path that puts them close together. These ideas come prior to cancelling 2s, as pondered above.

We can also look at combining three members with those same goals in mind. Here’s an example at l=65, s=41.

01101111010111101110110000010010011101110001111111011100111011101
                      H                    L A         B    C

L = lowest rational member (195.442)
H = highest rational member (62176.912)

Crucially, A is followed by 8 ups and 2 downs, which increases its value to B. If we follow 3 more ups and 2 more downs, we drop just a bit to C.

A → (8 ups, 2 downs in any order) → B → (3 ups, 2 downs in any order) → C

The 3n+1 math works out to where the drop (B-C) is always close to A.

In this case,

A = 440.996 (ie, the cycle member \beta(A) / \delta)
B = 2832.309
C = 2390.948

A - (B - C) = -0.365

This simple linear combination of members A, B, and C already has an absolute value less than one, meaning we can use it to safely rule out an integer cycle.

That’s without canceling any 2s yet. It happens there are three 2s that we can cancel, so the actual rule-out is even safer.

This same “8/2 → 3/2” up-down shape can be found in two other places in the same vector. In both cases, we see larger A - B + C values, and fewer 2s to cancel. One still rules out an integer cycle; the other doesn’t.

There are lots of other triple-shapes where A - B + C is relatively small by design.

PS. Any general no-integer-cycle proofs involving three- or four-member combinations will also have to show that the combination of \beta values isn’t zero (in addition to showing that it’s less than \delta). For example, consider 11110111000. There are four \beta values that seem to rule out an integer cycle … 2363 + 8479 - 5143 - 5699 < |\delta| … but actually the combination is zero, and in fact, 11110111000 is a (negative) integer cycle. In the case of two-member subtraction, this can’t happen, assuming the two members are distinct.

Following @AcidicJello , I posted this chart earlier. It shows how often the 2s-cancelling difference method fails to rule out a vector as an integer cycle.

I wondered where this failure rate goes, as cycle length l increases.

So … here is a larger chart. It looks like this method doesn’t work well for random vectors at large l! At least not for ones where 2^l-3^s (\delta) is unusually small.

l s failure rate sample size
8 5 28.1% 2000
27 17 2.7% 2000
46 29 2.6% 2000
65 41 10.5% 2000
111 70 0.1% 2000
149 94 6.0% 2000
233 147 7.0% 600
317 200 9.8% 600
401 253 17.2% 600
485 306 42.3% 1100
1539 971 37.6% 1100
2593 1636 36.3% 1100
3647 2301 37.0% 1100
4701 2966 35.8% 500
5755 3631 36.2% 500
6809 4296 40.8% 500
7863 4961 44.6% 500
8917 5626 42.6% 500
9971 6291 44.8% 500
11025 6956 49.4% 500
12079 7621 50.4% 500
13133 8286 45.6% 500
14187 8951 47.0% 500
15241 9616 54.0% 500
16295 10281 54.0% 500
17349 10946 58.6% 500
18403 11611 60.8% 500
19457 12276 64.8% 500
20511 12941 68.8% 500
21565 13606 75.2% 500
22619 14271 77.6% 500
23673 14936 85.6% 500
24727 15601 94.4% 500
75235 47468 97.0% 200
125743 79335 99.0% 200
301994 190537 100% 120

Combinations of more than two members helps. Here we look only at +1/-1 coefficients.

This table counts random vectors not ruled out (so “0 of x” rules out all random vectors).

l 2 members up to 3 up to 4 up to 5
24727 150 of 160 22 of 160 0 of 160
125743 119 of 120 66 of 120 0 of 120
301994 40 of 40 40 of 40 11 of 40 0 of 40

While the two-member method dies at large l, the n-member method might keep up … hard to tell.

This is a “method” in a very loose sense – there’s no theorem about which members to pick, or why. It’s just empirical. If such a theorem existed, it would also have to deal with the “combination equals zero” problem, as those combinations wouldn’t rule out integer cycles.

1 Like

Well, not much more I can think to say about all of that stuff, except…

It should be possible to prove that in the neighborhood of v’s smallest rational member, there should be enough small-ish members that some combination of them (via addition and subtraction) must result in a number between 0 and \delta-1, inclusive, even without any 2s cancellation.

However, the problem is the 0, because a bona-fide integer cycle can have such a zero. (As can non-integer cycles.)

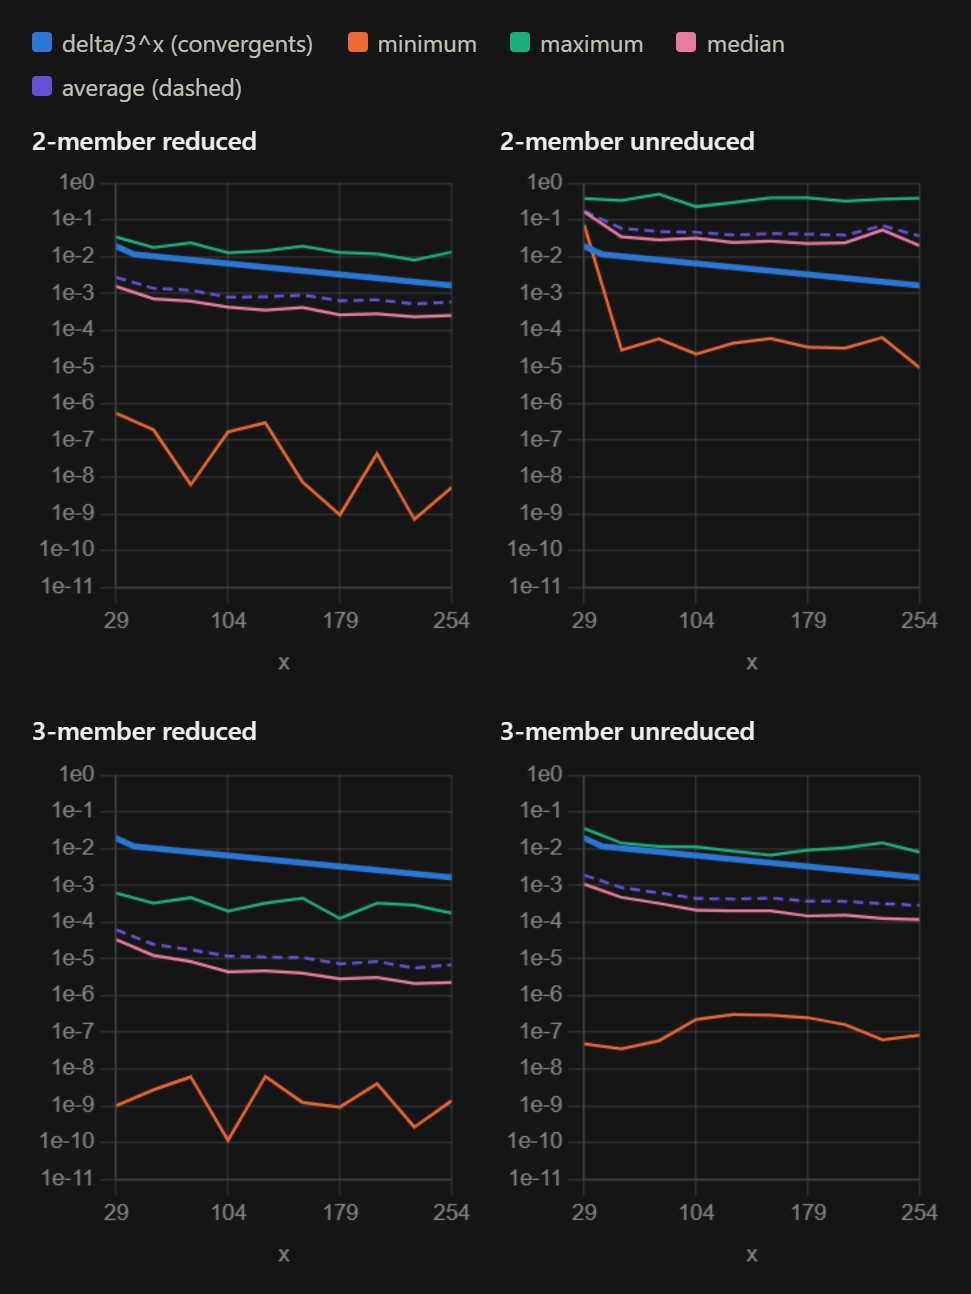
I ran more Claude C code, this time 1000 vector samples for every 25th x starting at x=29 up to x=254 odd steps (so up to vector length 403) and took the maximum, minimum, median, and average difference method result for each vector length. I did this for two members and three members (all possible such combinations were considered for each vector), and also separated the data into with and without dividing out the powers of 2 and 3.

In the plot below, the horizontal axis is x, and the vertical axis is the maximum, minimum, median, and average results divided by 3^x. I also included the blue line, which connects the delta values for the convergents of log3/log2, essentially acting as the worst case deltas, again divided by 3^x. My rationale is to visualize how small these values are relative to 3^x, given that delta is some pseudorandom number between 1 and 3^x and these results have to be less than delta in order for the method to rule out those vectors.

It helps just to look at the dotted line. I included the average and the median in case they were significantly different, but they follow each other pretty closely. The min and max just give a sense of the variability.

What I see is that every method seems to work most of the time (besides 2-member unreduced). Anything below 1e-2 (0.01, so 1% of 3^x) on the vertical axis is working more than 99% of the time. All three methods have an average result that start below 1% and in fact trend downward. By x=254, the full strength two-member difference method should be ruling out more than 99.9% of vectors. It seems like canceling the powers of 3 in addition to only doing the powers of 2 is what makes the difference between trending toward 100% success and 100% failure. The 3-member method with full canceling seems to be 100x stronger than 2-member with full canceling, and even 3-member without canceling is stronger than 2-member with canceling.

The only thing left to look at would be the trend of these lines. When I switched the horizontal axis to log scale, everything looked to slope downward in a straight line, which I assume means the downward trend is… actually I don’t know. If anyone is actually interested I can paste the raw numbers and you can find the actual equation of best fit and see how each method performs against delta out to infinity. Again, the blue line is the absolute lowest possible delta. The actual delta is usually way higher, between 1e0 and 1e-1.

I’m pretty sure I didn’t mention this yet, but maybe I did. Professional Collatz researcher Max Siegel did a Reddit AMA a while back in which he seems to state that a no nontrivial cycle proof would imply better bounds than Baker. I know we have discussed here that a transcendental bound would be implied by a proof, but this would seem to suggest that a proof using Baker-derived bounds cannot be strong enough.

“It’s known that Collatz is implicated in transcendental number theory. In particular, it is known that a proof that there are no non-trivial cycles would necessarily yield a much better estimate for how close 2^m and 3^n can be to one another as m and n vary among the positive integers. One of the first things I was able to prove using my methods is that while understanding the size of 2^m - 3^n would occur as a consequence of a proof of Collatz, the reverse is not true: even if we had a super powerful way of estimating how small the absolute value |2^m - 3^n| can get, that, in it of itself, would not be enough to prove that there are no non-trivial cycles.”

Unpacking this to know for sure what it means would take more effort than I’m willing to spend, but when I first read this I decided I would only work on cycles if it worked in the positive direction (What must a cycle look like if it exists? Can candidate cycles be constructed?)

The difference/combination methods seems to give the most information about candidate cycle vectors, out of anything. It doesn’t make the cycles it can’t rule out statistically likely to be integer cycles, but if the numbers are right it could narrow a candidate pool of vectors by an exponentially increasing proportion, and also tell you what shape properties the candidate vectors have.

For machine learning, I would like to see it learn how to manipulate and grow a vector to make it a better candidate (edit bits, rotate, append bits) by figuring out metrics like maximum difference and determining how to maximize them. I tried a very crude version of this idea a while ago by teaching a decision tree to construct the 3x+5 cycles, which it kind of did, in an unhelpful way. If I were to actually make the kind of ML experiment I would want to, it would require me to do a lot of research. I don’t want to make Claude do it at this point since I wouldn’t be able to understand what’s happening. Until then the challenge is open to anyone interested.

Ah, I see where you are going – try to find the cycle-shapes that are hard to rule out, and you might find a path to an actual integer cycle (Collatz counterexample). That seems like a great idea. Previously, people said “look where 2^l-3^s is small” and now you are saying “given such an l and s, look specifically at certain kinds of diabolical cycle-shapes”.

My understanding is that a no-cycle proof would imply (by Tao’s Propositions 6 and 7) that 2^n and 3^m are separated a huge amount that (currently) only transcendence techniques can prove. But Tao’s propositions still say that amount is weaker than what was proved by Baker, not stronger. (There might be other results besides Tao’s that I don’t know about.)

The rest makes total sense to me—there’s no “almost-proof of Collatz” that sits awaiting only a stronger theoretical separation of 2^n from 3^m. (That I know of … there might be results I don’t know about.)

The ultimate problem to overcome for cycle hunting (which I think I learned from your presentation) is that given random distribution of residues, there are effectively no cycles outside of the established search area (like 0.00000000…1% chance). Only looking at small delta improves your odds per vector, but just in the sense that 99% of that 0.00000000…1% occurs over small delta. Therefore if a cycle exists, it has to have to exist, which is only possible because Collatz is not random. One idea would be to find some kind of “a cycle must exist for this true property to hold”. The idea I mention here is more along the lines of “if a cycle exists, you will run into it by travelling in this direction or by these rules”. There’s one more idea I’ve come across, from someone else, which is that if you run the trajectories of enough really big random numbers, one of them might fall into the basin of attraction of a cycle beneath it, which kind of amplifies its area of effect.