Categorization of collatz numbers into 8 classes

Consider an empty tape with all unmarked cells, such that the reading head (standing initially in the middle of the tape) applies the collatz function to a starting n:

f(n) = \begin{cases} n/2 & \text{if} \quad n \equiv 0 \quad (\text{mod}\, 2) \\ 3n + 1 & \text{if} \quad n \equiv 1 \quad (\text{mod}\, 2) \\ \end{cases}

flipping the state of the cell it currently stands in, and then moving left if n is odd, and right if n is even. It will do this until n = 1 is reached. Consider the example of n = 27:

collatz_tape27

and the corresponding tape development over time (↓):

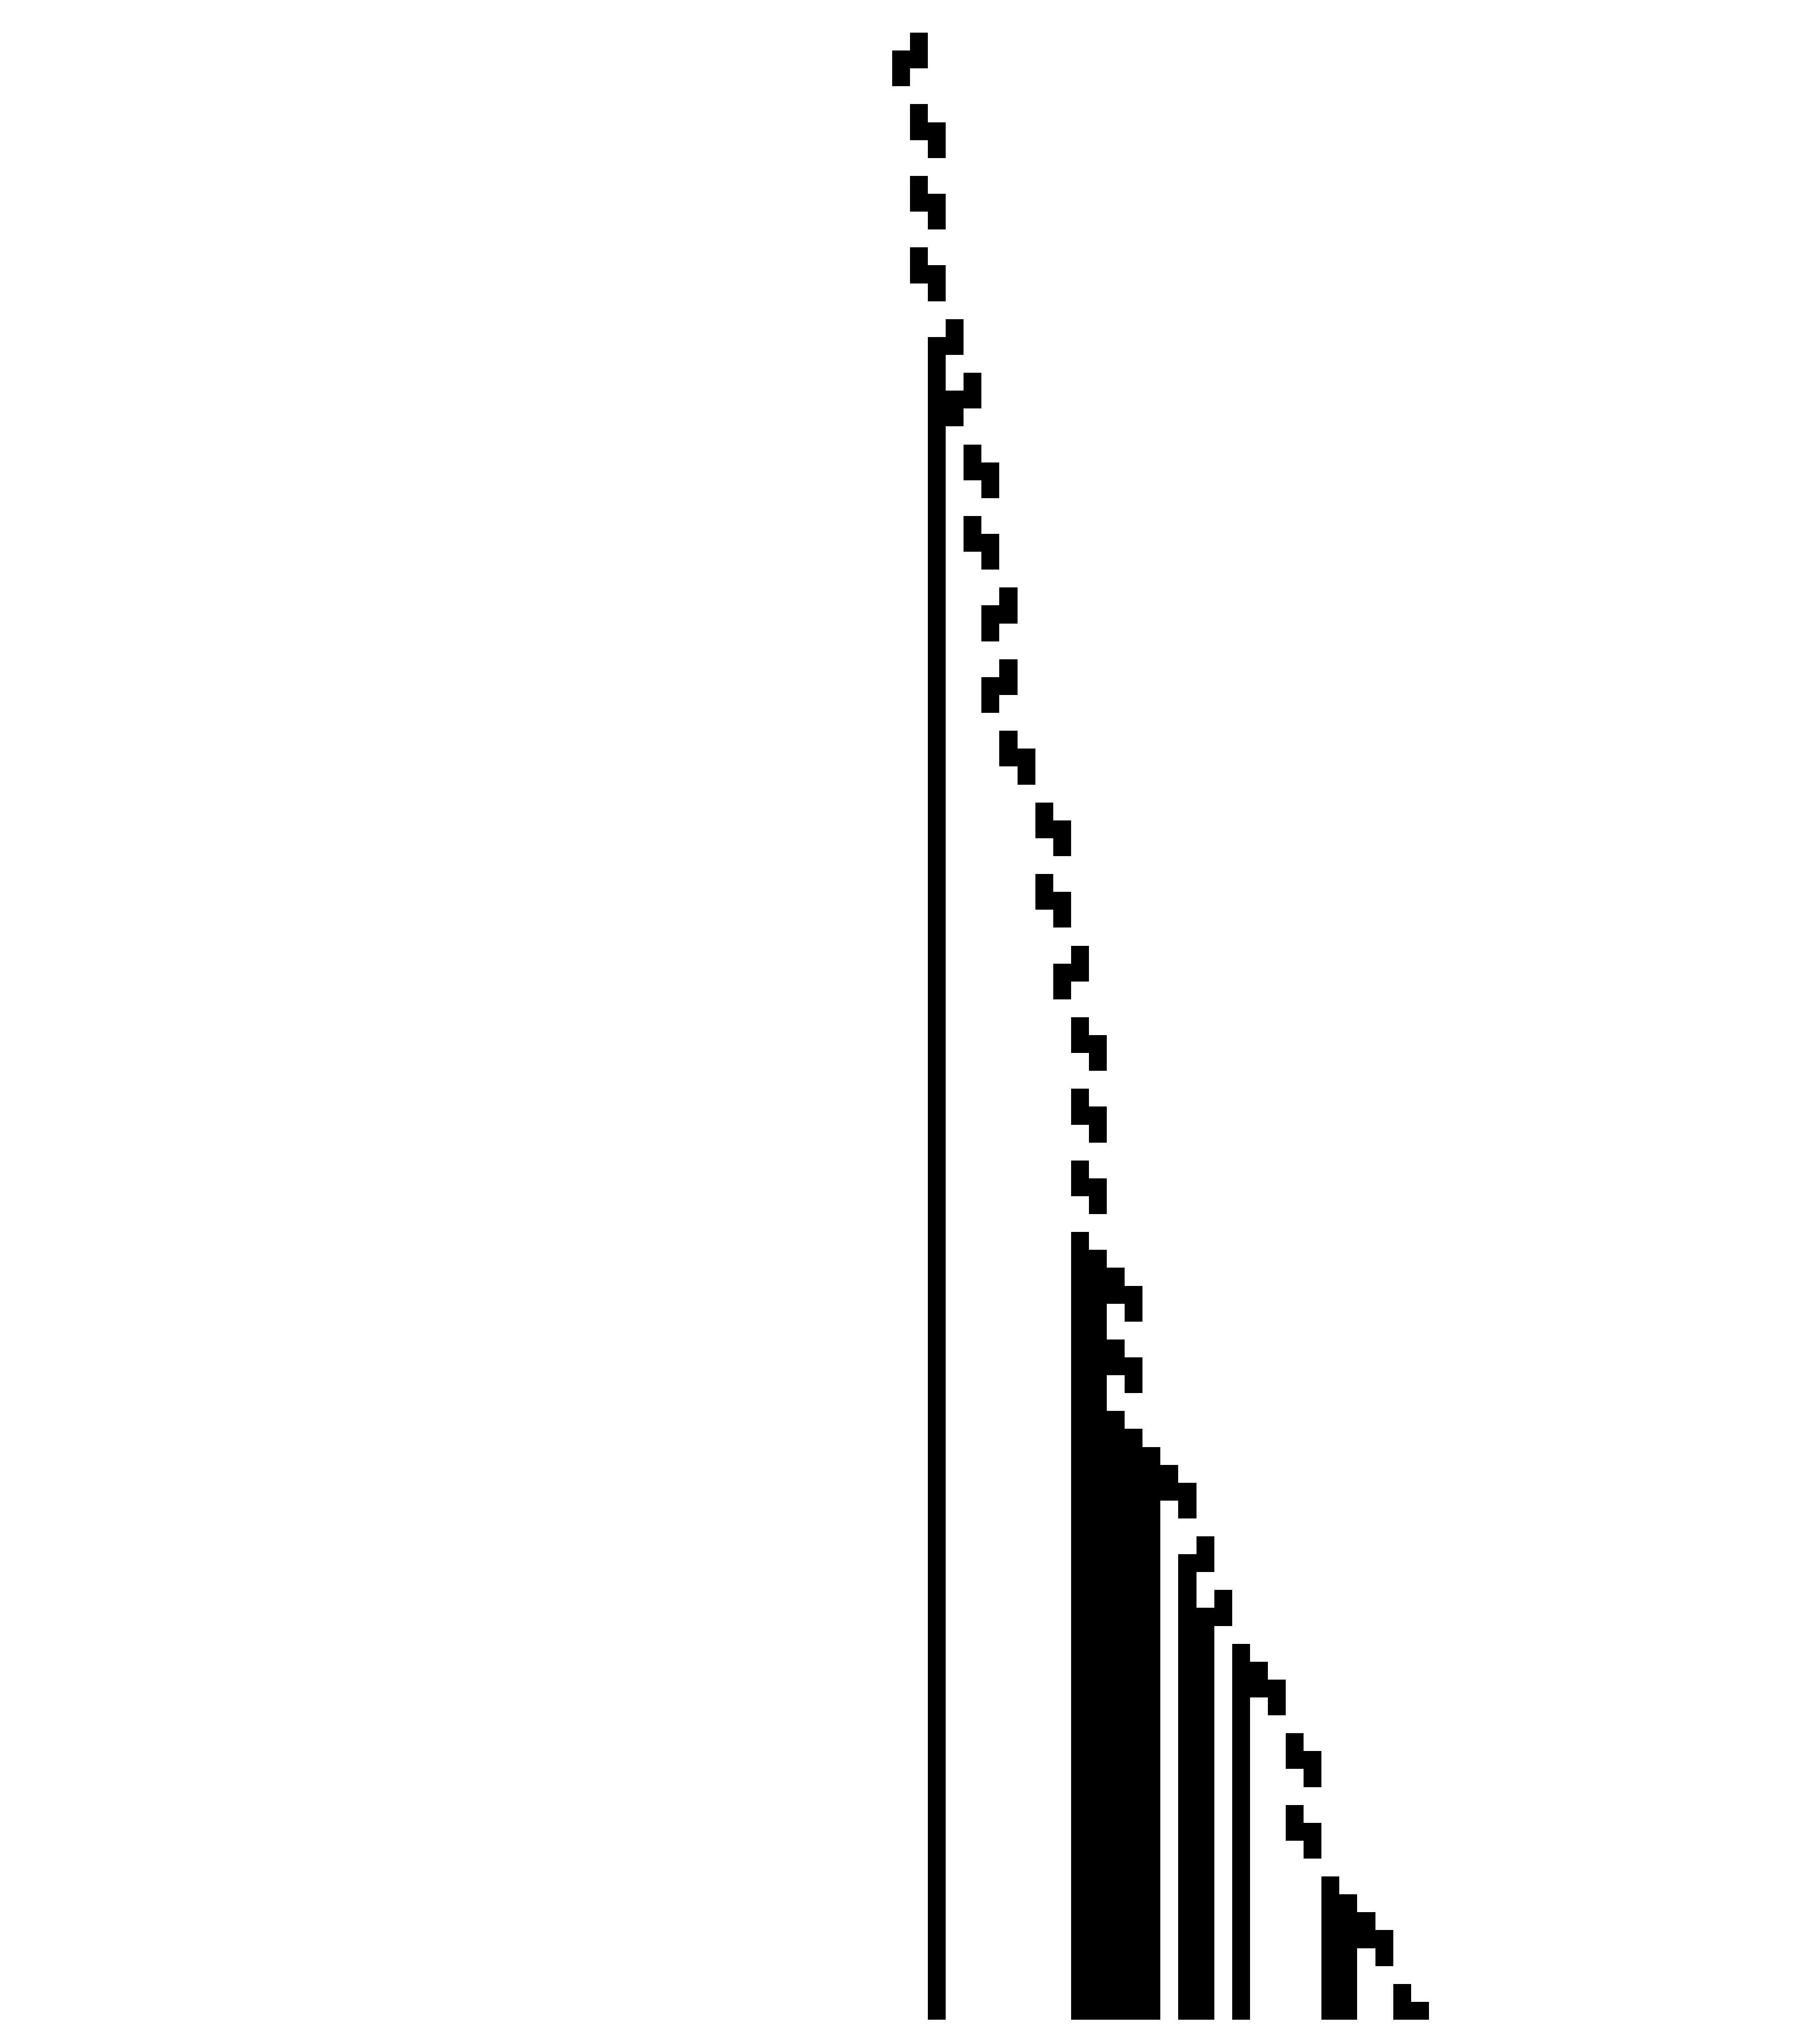
It has a stopping time of τ = 111, and at the last iteration before halting the tape has 13 marked cells (or 1s) - Σ = 13. Furthermore, from said last iteration we can also get the tape configuration in a compressed form (in a similar manner as discussed in this blog post). It will look like this T = 1000000011111011010000110011, which in a more compressed format will be shown as T = 1^{1}0^{7}1^{5}0^{1}1^{2}0^{1}1^{1}0^{4}1^{2}0^{2}1^{2} (and of course ignoring the infinite sequences of zeros on the left- and right-hand sides of the tape, i.e. T = 0^{\infty}1^{1}0^{7}1^{5}0^{1}1^{2}0^{1}1^{1}0^{4}1^{2}0^{2}1^{2}0^{\infty}). We’ll also consider 1^{\text{space}(n)} where \text{space}(n) is the number of uniquely visited tape cells. For n = 27, \text{space}(n) = 30, such that 1^{30} = 11111111111111111111111111111. What we’re interested in is the ratio \frac{T}{1^{\text{space}(n)}}. In the case of n = 27 we have:

\frac{T}{1^{\text{space}(n)}} = \frac{1^{1}0^{7}1^{5}0^{1}1^{2}0^{1}1^{1}0^{4}1^{2}0^{2}1^{2}}{1^{30}} = \frac{1000000011111011010000110011}{11111111111111111111111111111} ≈ 0.009

This ratio can generally be interpreted as the capacity of each n to mark (and keep marked) every cell which it visits. The only examples with \frac{T}{1^{\text{space}(n)}} = 1 are powers of 2, which always move right and convert 0s into 1s until halting.

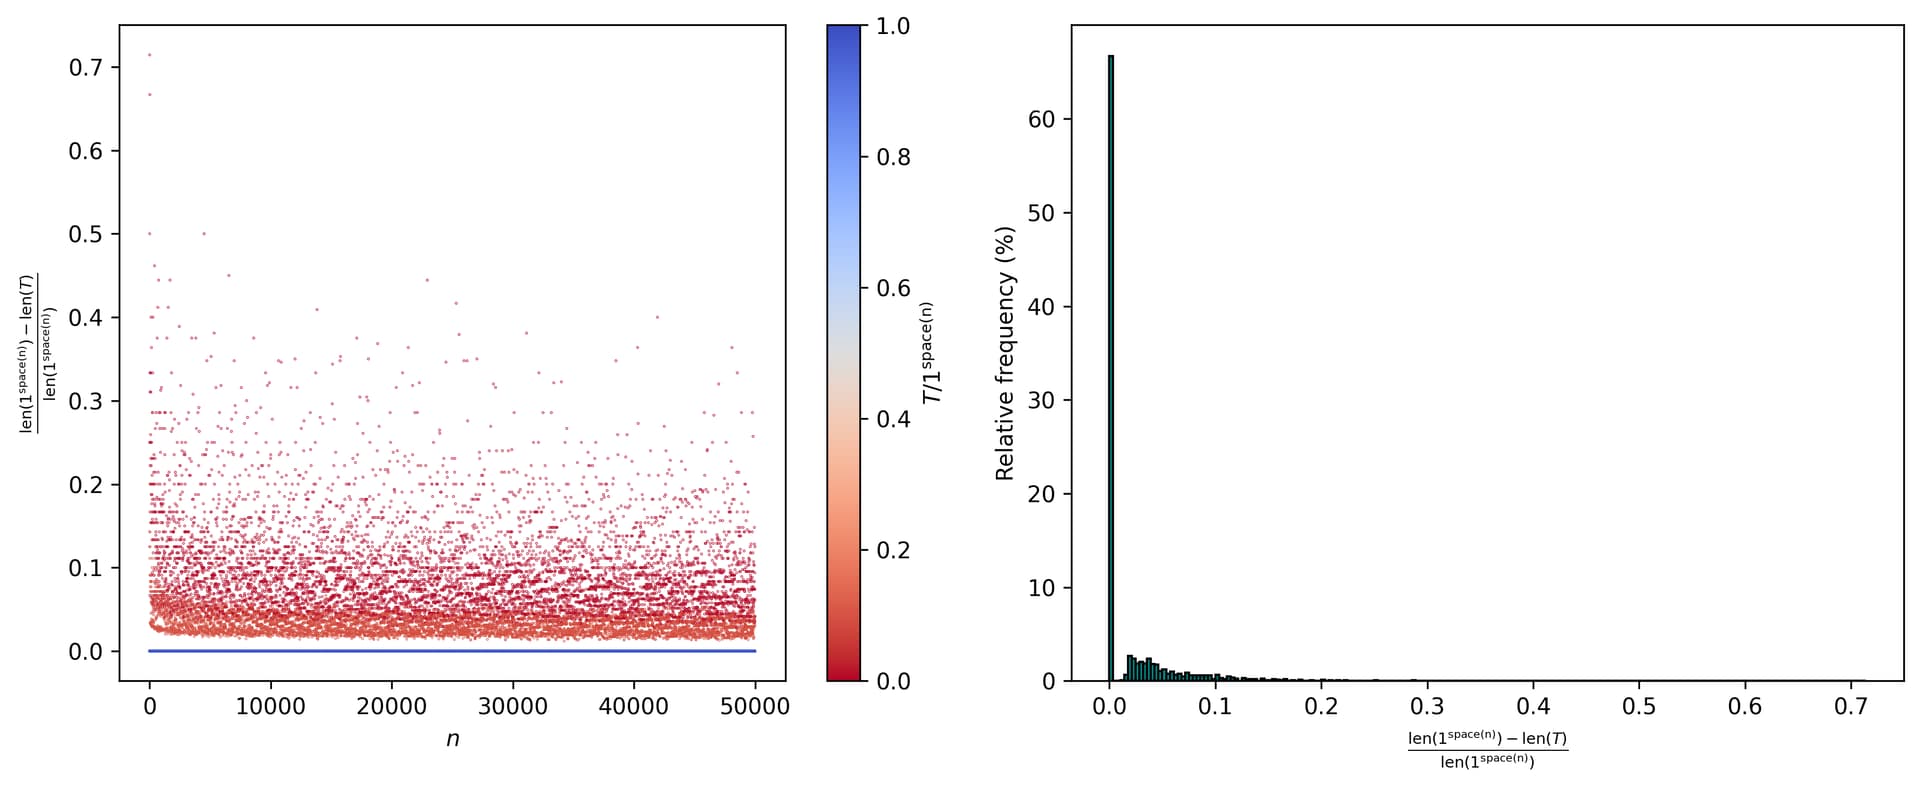
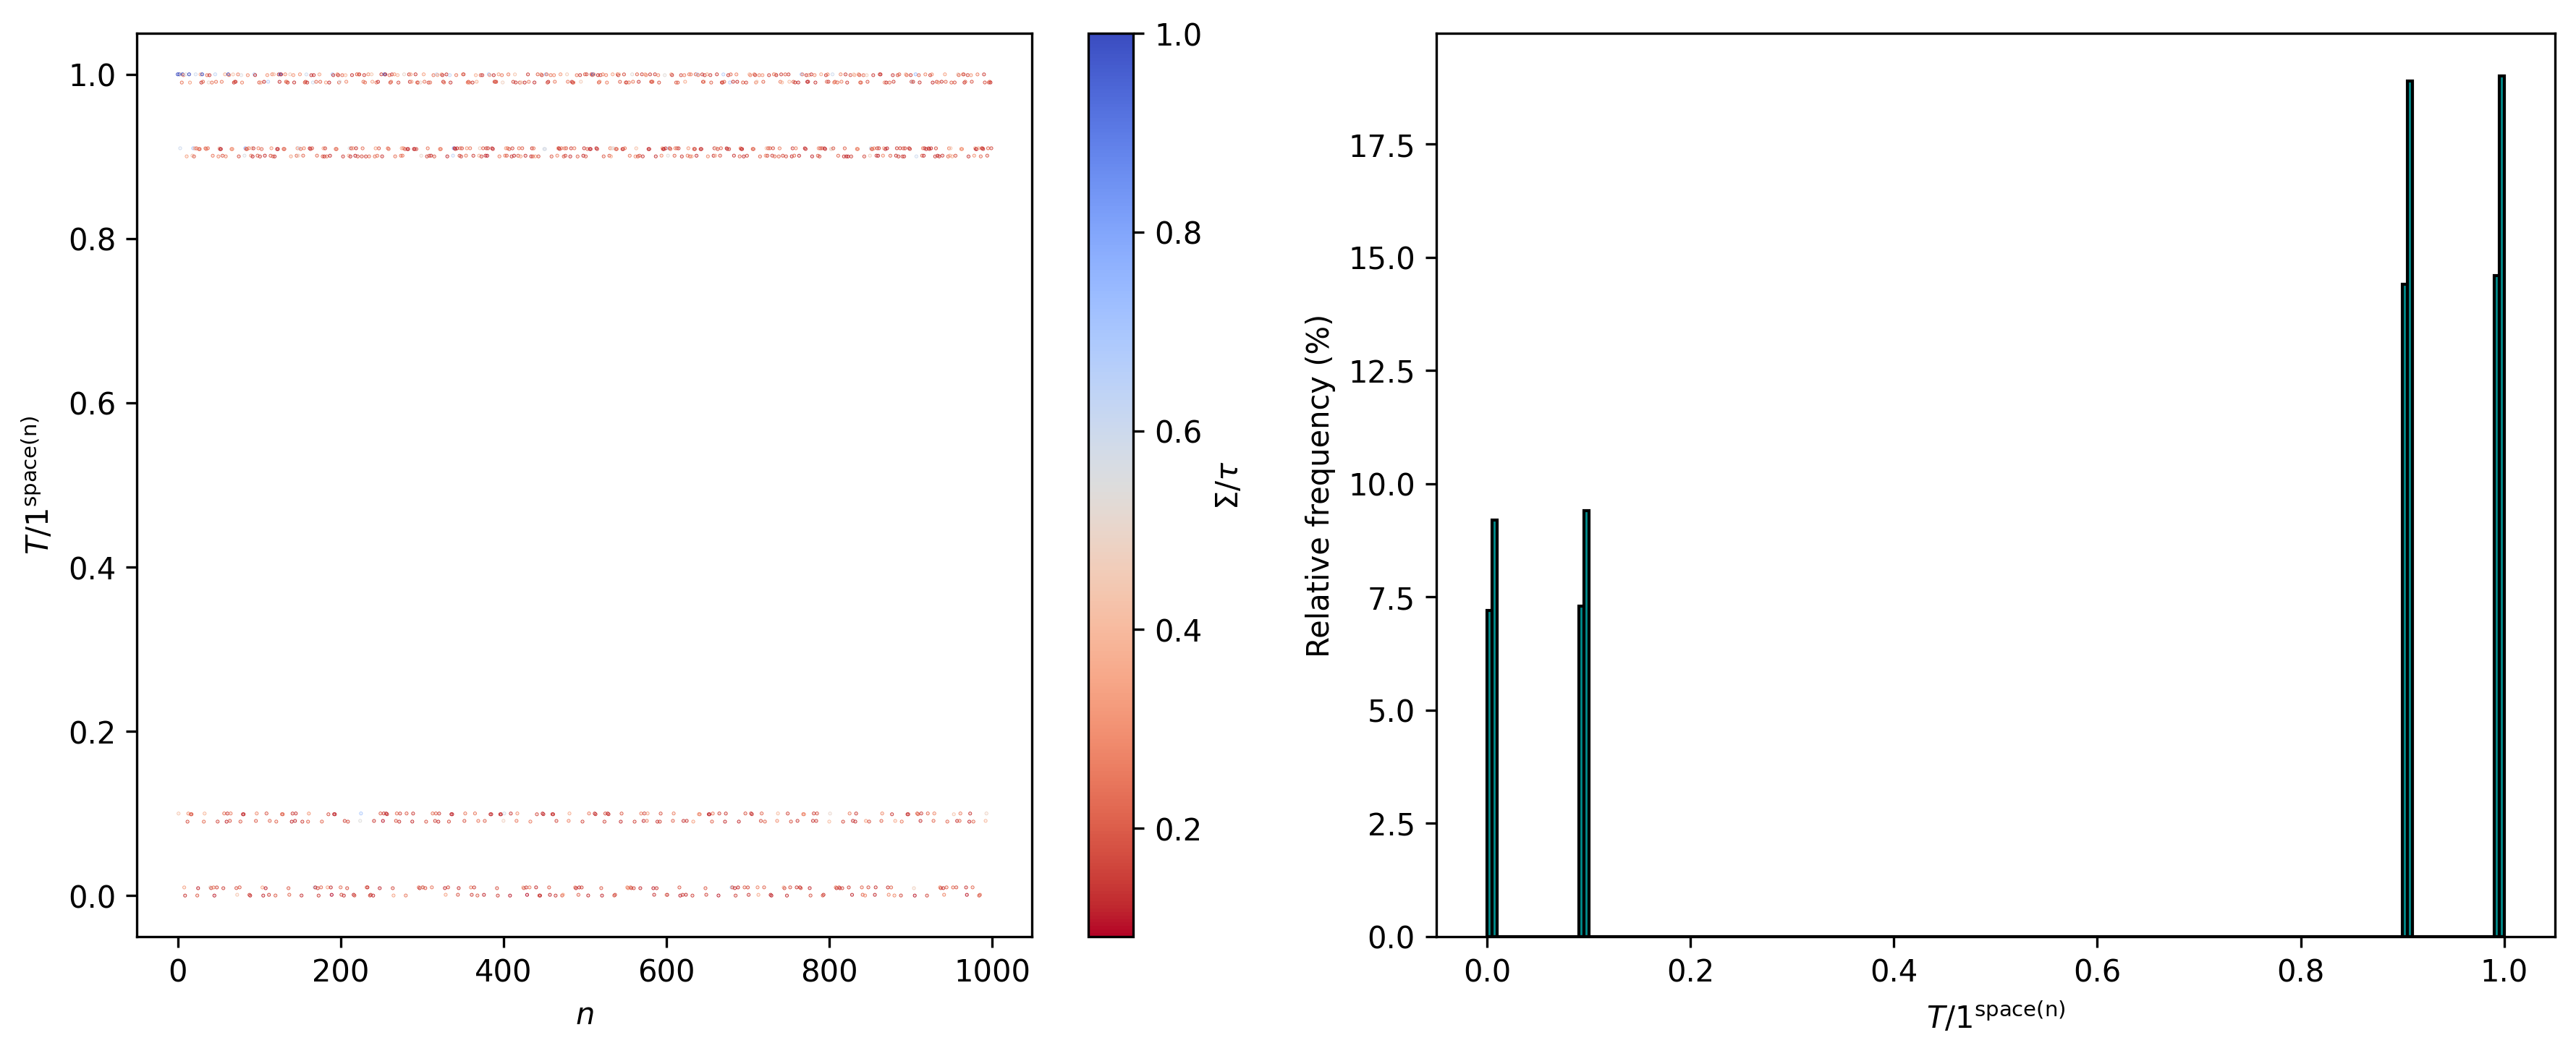
Ok. Now, let’s see how such ratio changes for n from n = 2 to n = 10^{3} (also representing a color-coding for Σ/τ and showing a histogram for T/1^{\text{space}(n)}):

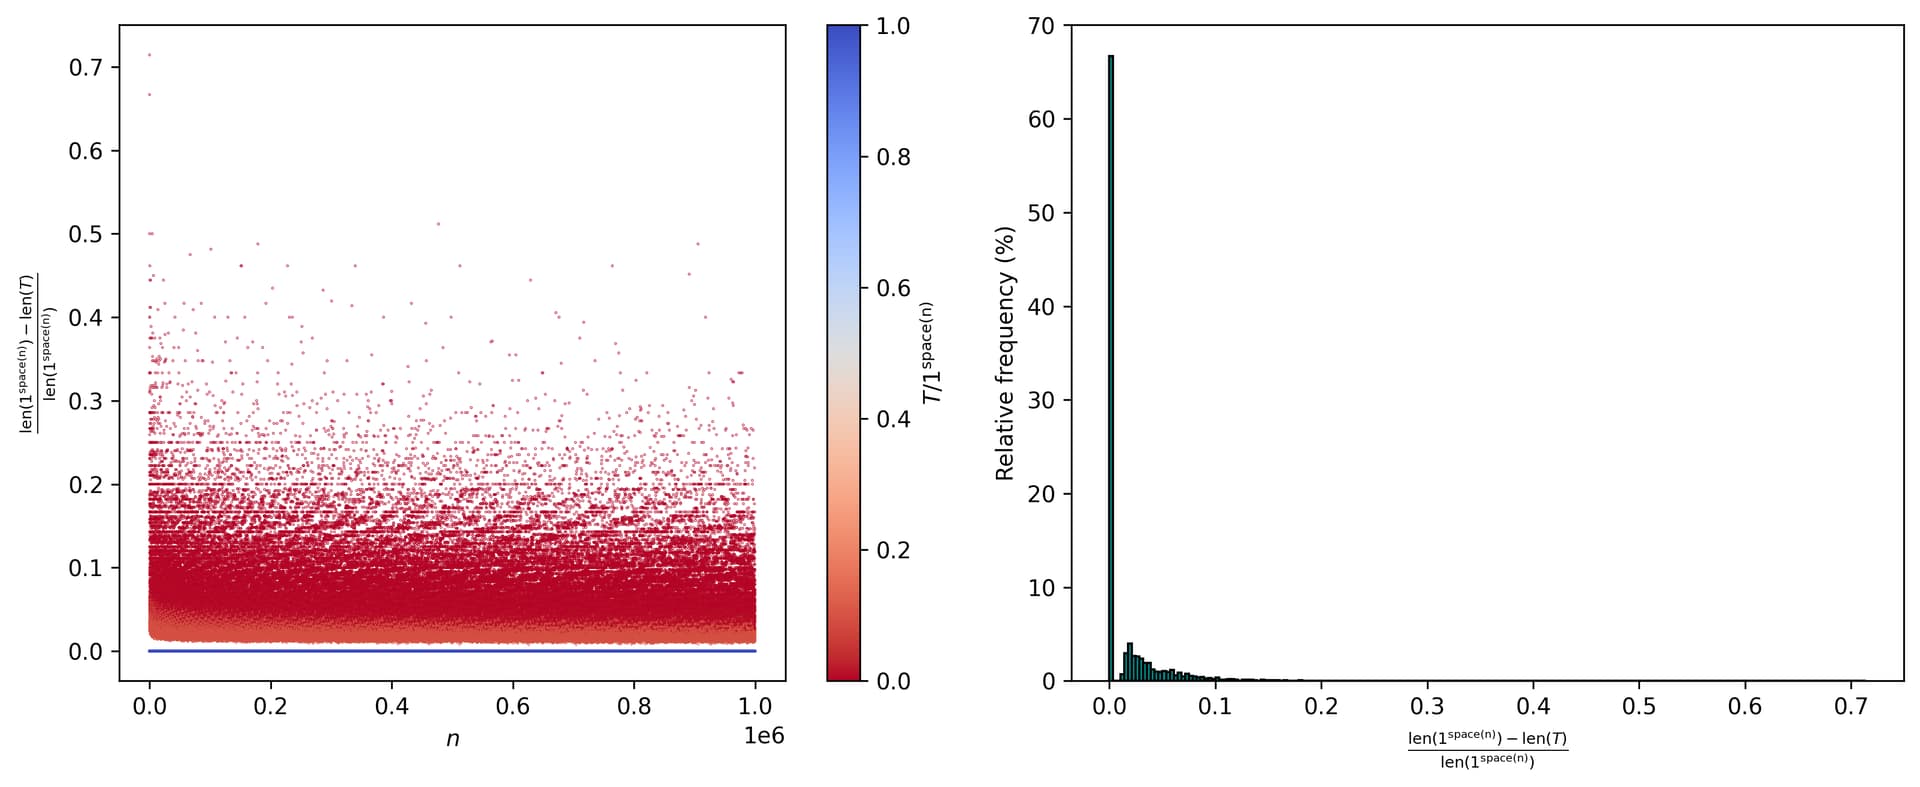
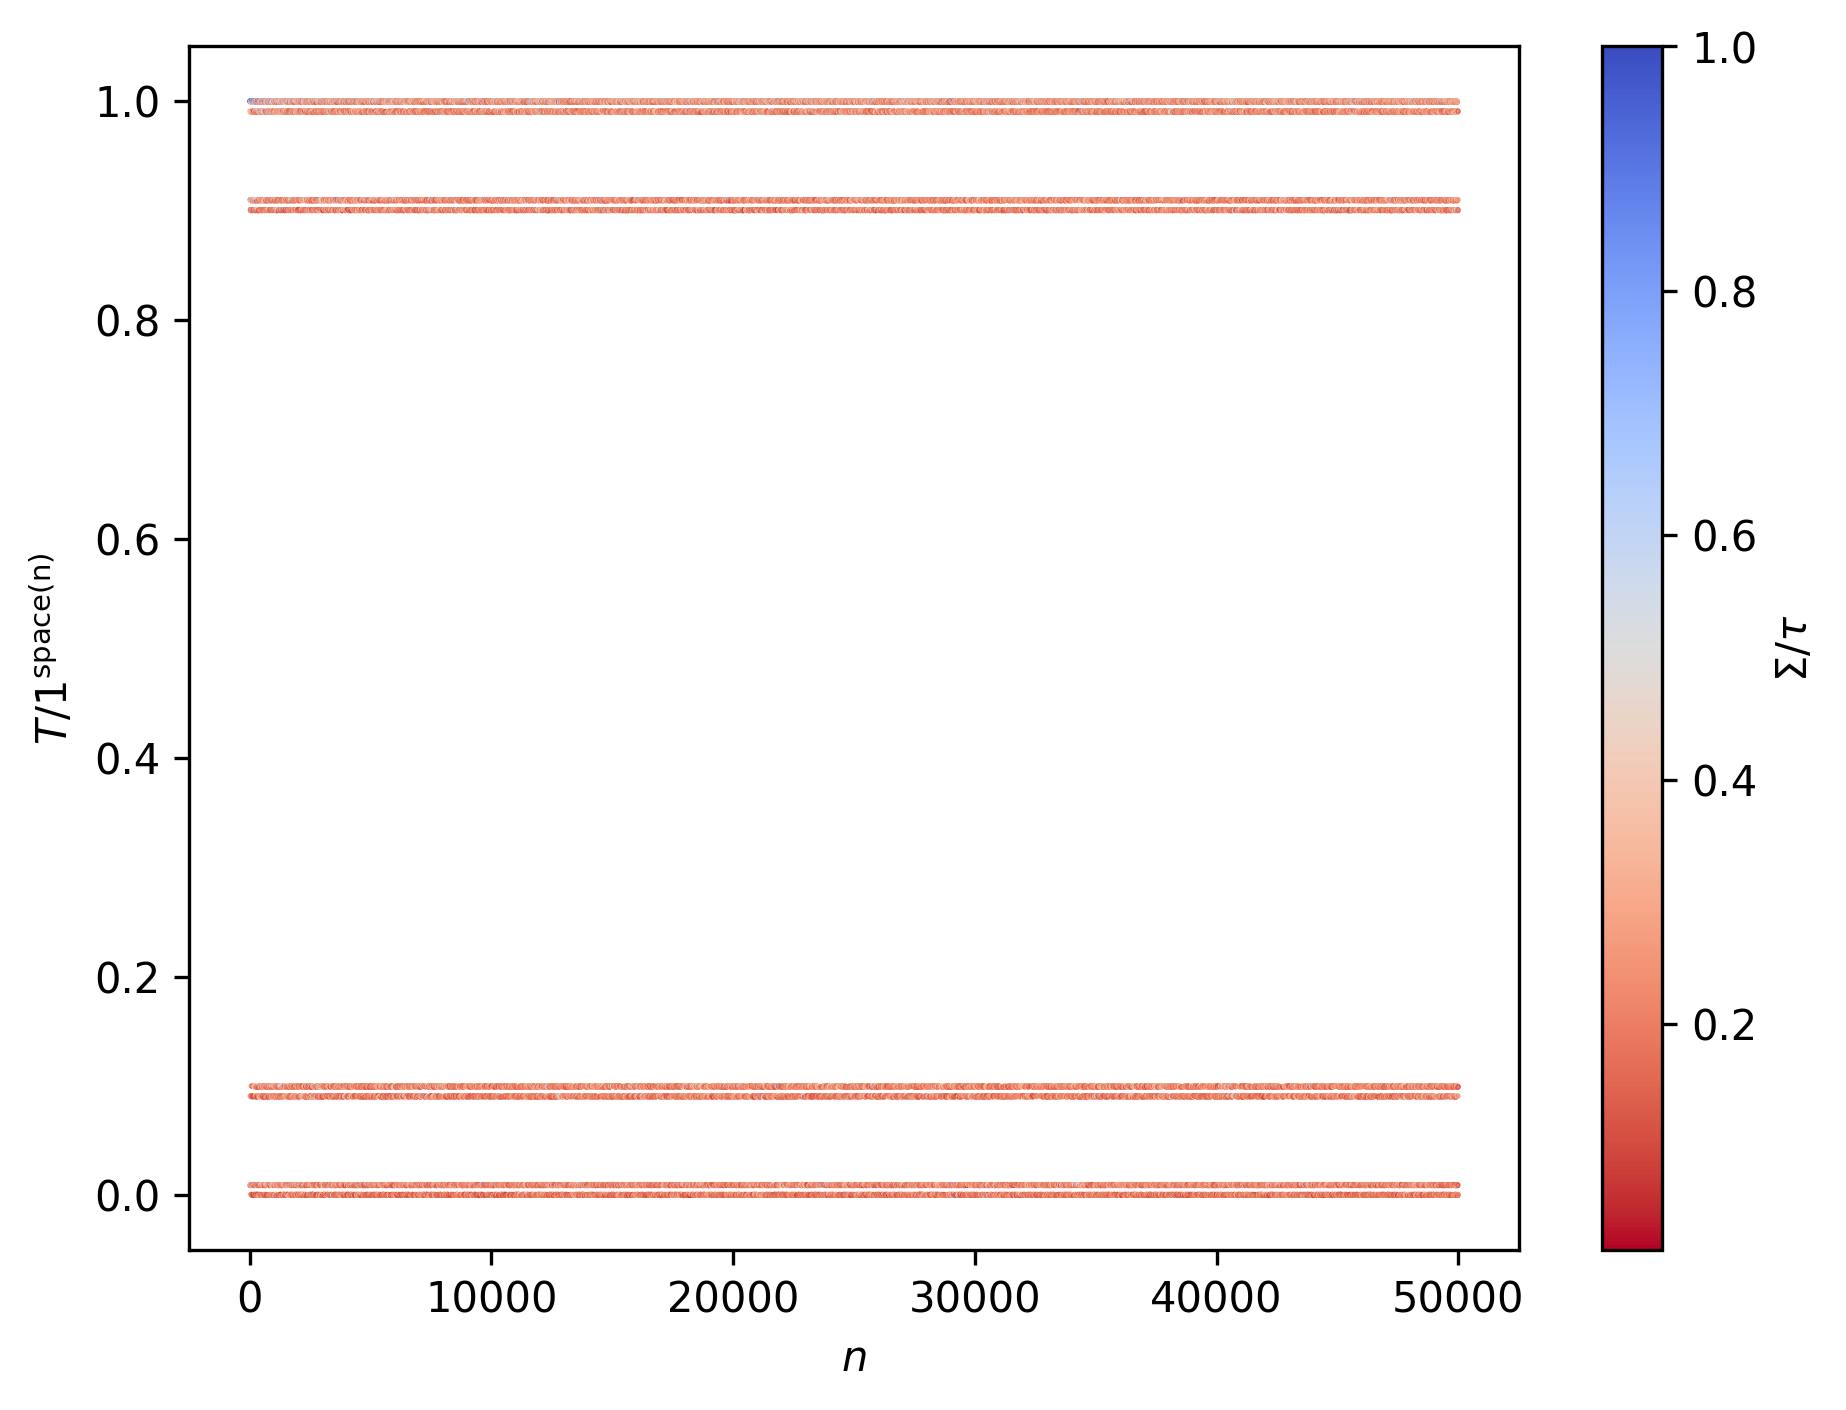
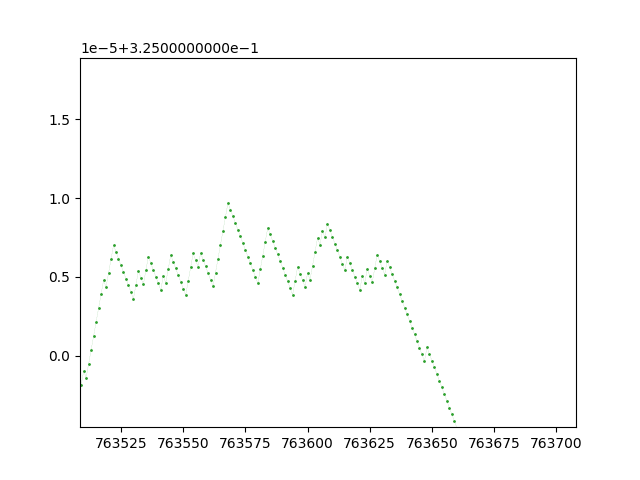
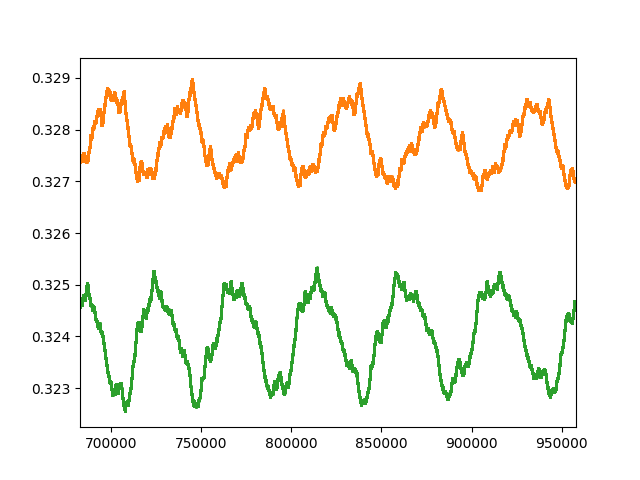
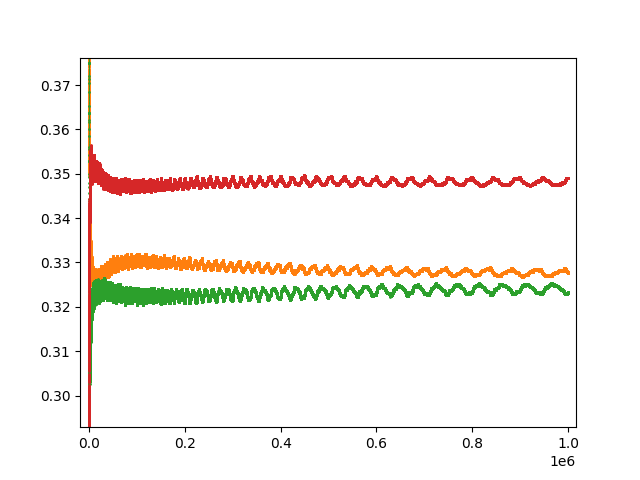
Ok, that’s somewhat interesting. Does such pattern change? Consider n from n = 2 to n = 10^{6}:

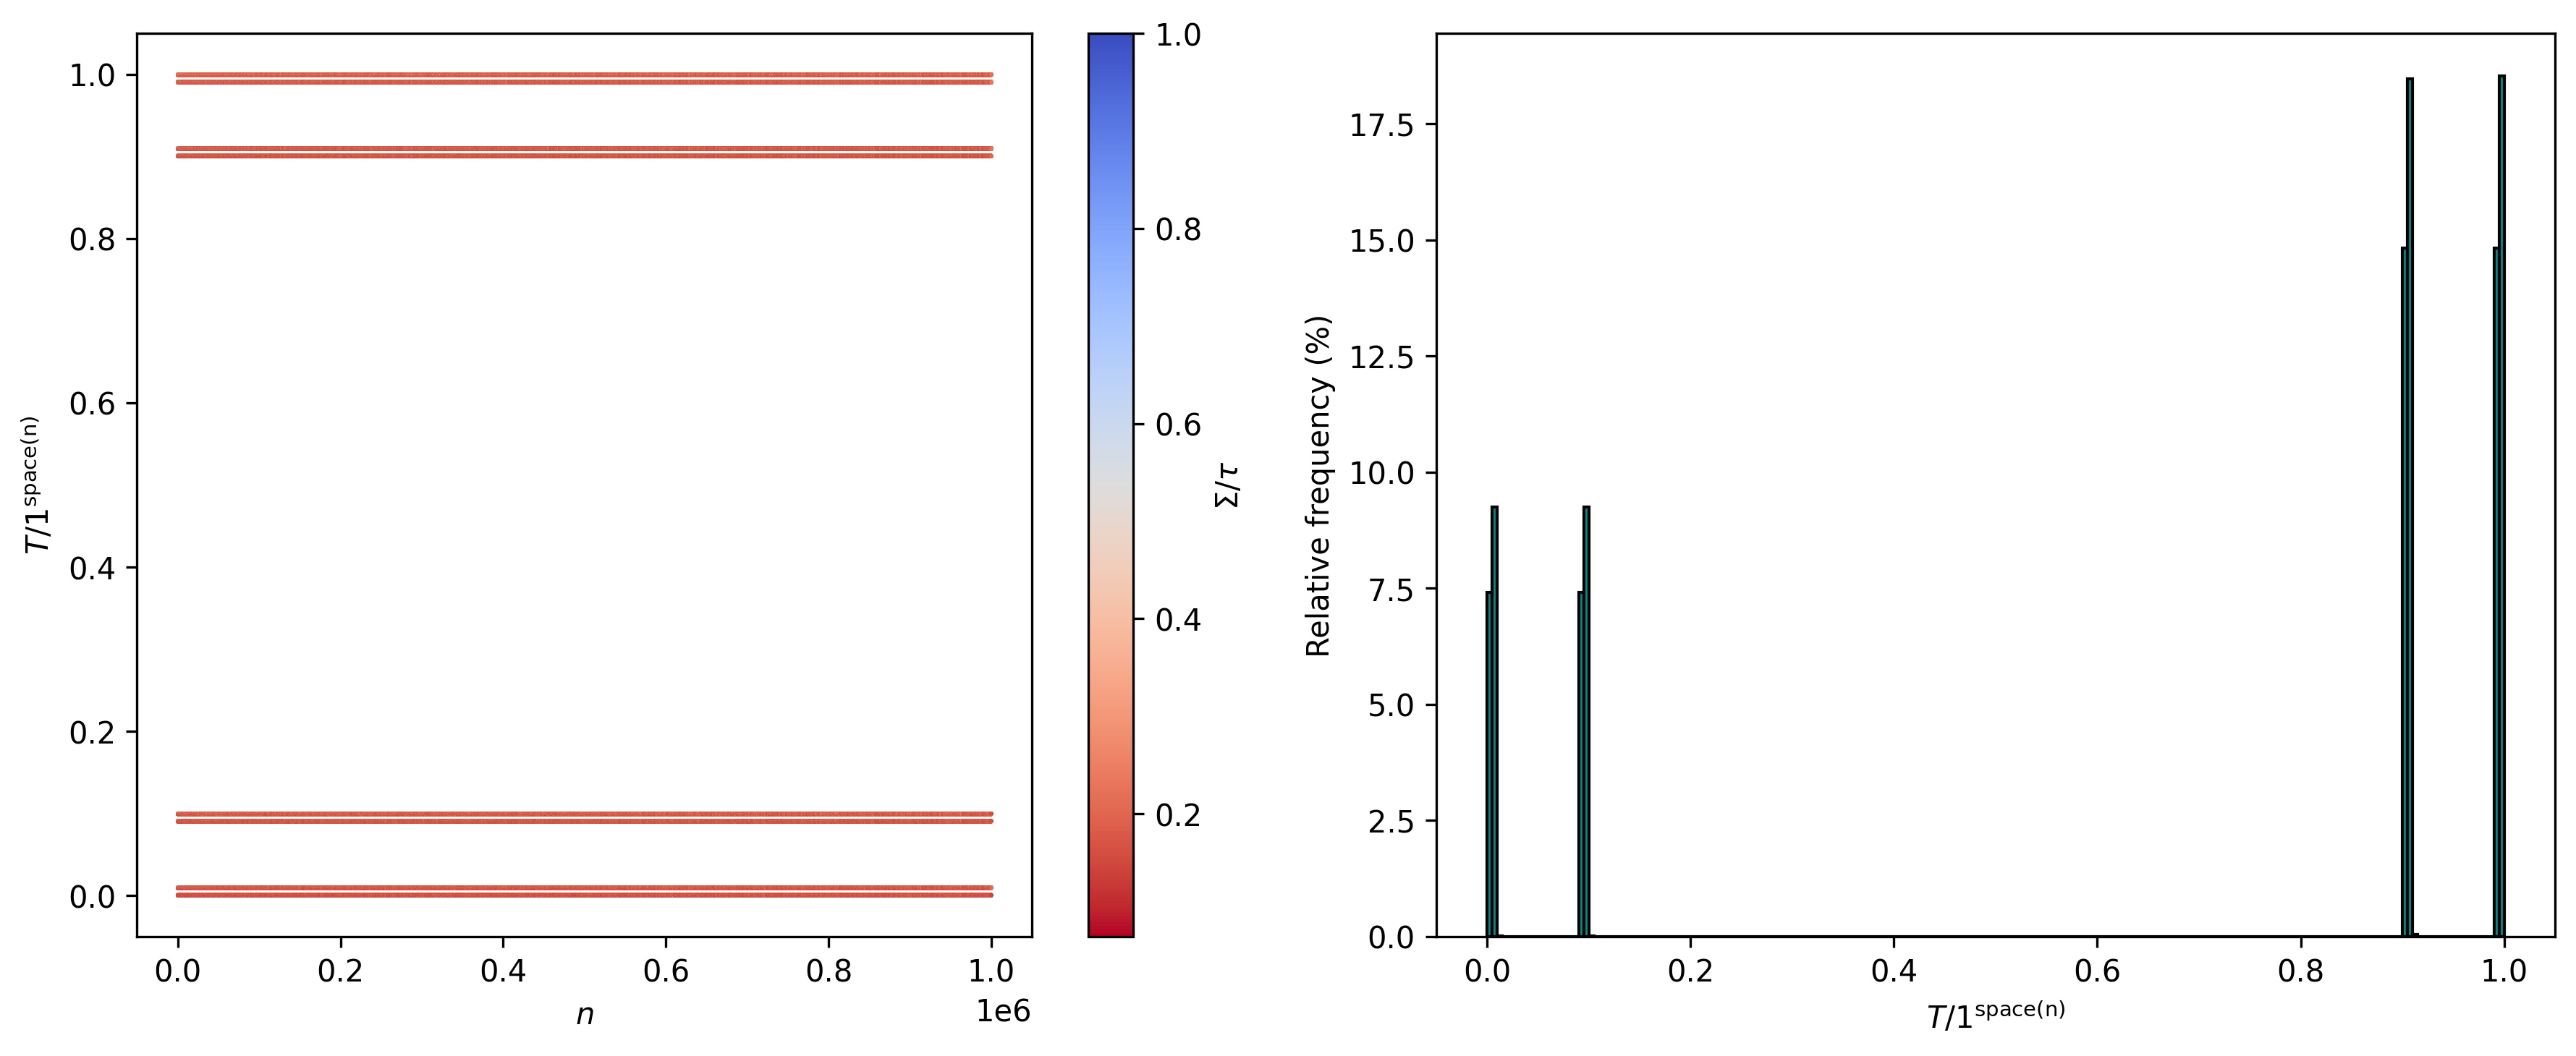
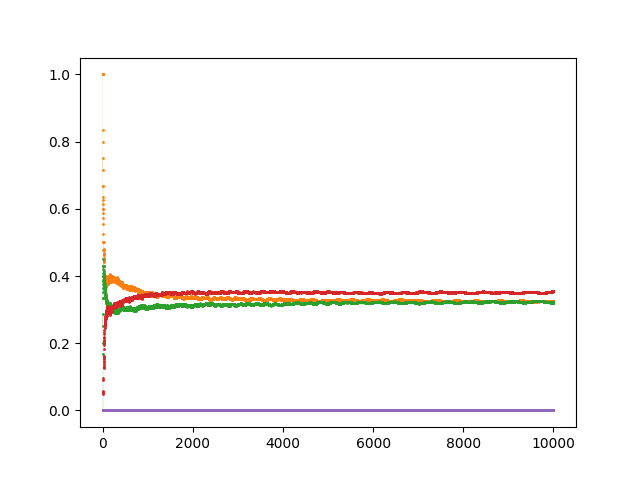
We still see those 4 major classes, each with 2 sub-classes. Additionally, and enumerating said (sub)classes in an ordered manner, we have convergence to the following relative frequencies (along with the thresholds of T/1^{\text{space}(n)} for each (sub)class):

C_{1} ∈ [0, 0.005[\quad → \quad 7.4 \%\\ C_{2} ∈ [0.005, 0.01[\quad → \quad 9.25 \%\\ C_{3} ∈ [0.09, 0.095[\quad → \quad 7.4 \%\\ C_{4} ∈ [0.095, 0.1[\quad → \quad 9.25 \%\\ C_{5} ∈ [0.9, 0.905[\quad → \quad 14.8 \%\\ C_{6} ∈ [0.905, 0.91[\quad → \quad 18.5 \%\\ C_{7} ∈ [0.99, 0.995[\quad → \quad 14.8 \%\\ C_{8} ∈ [0.995, 1]\quad → \quad 18.5 \%\\

Here we notice the relative frequencies for C_{5} and C_{7} being double those of C_{1} and C_{3}, and likewise those of C_{6} and C_{8} being double those of C_{2} and C_{4}. But why those specific frequencies? I would assume that a good chunk of this presumably has to do with the way the last iteration of the tape T was represented (and correspondingly with 1^{\text{space}(n)}).

But is there any reason a given n should belong to anyone of these classes (beyond the trivially acessible explanation of its tape development)? In other words, can one find an expression for the numbers in any given class, thus being able to infer some part of the tape development merely by understanding which class a given n belongs to?

Let’s restrict our examples to n from n = 2 to n = 100. These are the corresponding $n$s distributed according to the class they belong to:

C_{1}: 11, 26, 47, 75, 90, 91\\ C_{2}: 10, 27, 42, 43, 46, 50, 58, 74, 78\\ C_{3}: 14, 34, 51, 62, 66, 79, 98\\ C_{4}: 3, 15, 18, 19, 35, 59, 63, 67, 82, 83, 99\\ C_{5}: 13, 20, 22, 45, 52, 57, 61, 77, 84, 92, 94, 100\\ C_{6}: 5, 21, 23, 25, 28, 29, 36, 37, 39, 53, 54, 55, 68, 69, 85, 86, 87, 89, 93, 95\\ C_{7}: 7, 17, 31, 33, 40, 44, 49, 56, 71, 72, 73, 81\\ C_{8}: 2, 4, 6, 8, 9, 12, 16, 24, 30, 32, 38, 41, 48, 60, 64, 65, 70, 76, 80, 88, 96, 97\\

I’m not sure there’s an immediate pattern that is easy to recognize for any of these classes…

Additionally, I wonder if there are analysis of parity (and re-framings of the problem) which might give similar results?

In the case there are any formatting issues, I have pretty much the same written in this blog post.

1 Like

I’m curious what happens when you let a tape develop with just a random sequence of lefts and rights, with some weight given to left or right based on how we know collatz sequences evolve probabilistically. Does it give similar results?

3 Likes

@Fibra Nice! I take your ratio \cfrac{1000000011111011010000110011}{11111111111111111111111111111} to be one decimal number over another, in this case \approx 0.009. I think your classes (more or less) amount to how many digits the numerator has compared to the denominator. If they’re the same length, the ratio has to be between 0.9 and 1.0. If the numerator has one less digit than the denominator, the ratio is between 0.09 and 0.1 … if two less digits, the ratio is between 0.009 and 0.01 … if three less digits, the ratio is between 0.0009 and 0.001.

So what kind of start number visits m total cells outside its final 1...1 range, but leaves them unmarked? No idea … :frowning: It seems like we know so much about the first few iterations of start number n, but so little about what happens later.

2 Likes

Late response by me here, but indeed what seems to matter the most is the magnitude of T or the corresponding length of the str which will be generated (when compared to that of 1^{space(n)}). And this can be maximized either by powers of 2 which will move right turning every tape cell into a marked one until halting, or by numbers that put a marked cell the furthest distance away in the left side of the tape, and that don’t end up revisiting that cell by the end of the run thus unmarking it. By curiosity, I checked the normalized lengths of the strs, i.e. (len(1^{space(n)}) - len(T))/len(1^{space(n)}), and from n = 2 to n = 50000, we have the following:

And this distribution doesn’t seem to change considerably over a bigger range. Here represented till n = 10^{6}:

It seems the results are a product of the representation more than anything else indeed.

These are for random tapes generated from corresponding collatz stats (corresponding script). For each tape I only took the stats for a corresponding n, namely the odd-even ratio and the stopping time. The evolution of the tape is dictated within these constraints, and according to a randomly generated number r which will give the direction to be followed for each step.

Any differences in tape generation will lead to a change with regards to the class said tape will belong to, such that the existence of the classes themselves can be completely attributed to the representation and nothing else (albeit this graph is a product of a single simulation, but after running a few, nothing changed).

This whole thing reminds me of the time I tried to find meaning for the repartition of negatives among the different negative collatz cycles. It presented weird almost-regularities but nothing I could make sense of. Not sure I still have the figures on my computer but if they are still there I may post them.

Found it! So, here are the graphs:

So, at any abscissa N the orange dot is the proportion of numbers in [-N-1,-1] that ends up on the (-1) cycle, the green dot is for those of the (-5,-7,-10) cycle and the red one for the (-17… etc) cycle. Purple is for the (0) cycle but nobody cares about this one. Here it seems like it stabilizes, but it’s not clear at all.

Here is a zoom somewhere on the graph to show what that looks like from very close

Another zoom, way less close, but that seems to show oscillations.

Here is a different scale but better appreciate those oscillations and how they seem to vary in frequence but not so much in amplitude.

I haven’t found the source code for this yet but I’m confident it’s not lost. It wasn’t big either.

1 Like