Discovery via classifiers and/or AI?

Here’s a transformer learning to predict total stopping time (TST) but this time using base-24 start numbers and TSTs.

100k start numbers, chosen between 1 and 10^{12}, with 80/20 train-test split.

Sample instances of the mapping:

6 2 0 2 22 5 14 11 23 → 6 11
6 7 16 15 20 15 18 7 3 → 5 10
6 21 17 17 0 7 18 5 23 → 4 23
2 6 9 5 16 19 11 8 11 → 8 22

Results:

Base Epoch Loss Train Seq Acc Test Seq Acc
24 100 1.05 11.77 9.36
200 0.98 15.42 10.06
300 0.94 17.46 9.94
400 0.91 19.42 10.19
500 0.88 22.07 10.08
600 0.83 25.43 9.72
700 0.82 27.07 9.71
800 0.80 31.13 9.46
900 0.71 35.31 9.11
1000 0.67 41.34 9.01

The improvement over base 2 is impressing. This looks really promising. The accuracy on the test sequence is now close to 10%, whatever the number of epochs (above 100). Maybe this has something to do with Korec’s base-6 automaton.

Hopefully, using more training data will prove more rewarding than using more epochs. Then try to add more test data and see if we can maintain a decent accuracy.

Another way to go might be to try the rational base 3/2, as in Eliahou and Verger-Gaugry paper. This representation uses 3 digits (0,1,2) as in base 3, and the algorithm for a positive integer n goes as follows:

  1. Set i=0;
  2. Compute digit a_i = 2n \pmod 3;
  3. Set n = (2n-a_i)/3;
  4. Set i=i+1;
  5. Go back to step 2 until n is equal to 0;

In the end, the representation is a_k ... a_2 a_1 a_0 with a_0 the least significant digit and k=i-1.

Hard to predict the outcomes on TST prediction accuracy.

1 Like

@oros Sounds good, should be easy to try more things.

Note that the base-24 and base-2 experiments aren’t strictly comparable, since the base-24 run draws train & test start numbers both from the same distribution [1, 10^{12}], while the base-2 run trains on [1, 80000] and tests on [80001,100000].

There’s no actual train/test overlap in the base-24 case, but maybe some spiritual overlap.

For example, the C&N prediction of the 1^* 0^* initial-trajectory landing spot likewise has train/test both drawn from [1, 10^{12}], so examples look like this:

6 2 0 2 22 5 14 11 23 →
23 2 8 17 2 16 0 16 7 (gold)

6 7 16 15 20 15 18 7 3 →
7 2 15 17 20 5 17 14 1 (gold)

My replication got 96\% on test instances, although when I test the model on larger numbers drawn from [1, 10^{20}], the predictions are naturally too short:

14 7 20 12 16 9 16 6 0 12 20 14 8 1
→ 10 17 21 9 12 7 6 4 12 9 15 10 18 1 (gold)
→ 5 8 21 14 18 7 15 5 (predicted)

3 16 4 11 16 18 16 13 21 23 20 7 3 6 7
→ 1 13 4 21 10 10 21 5 20 21 16 10 12 6 1 (gold)
→ 4 15 14 16 7 8 23 5 17 (predicted)

The base-2 TST predictor learned (to some degree anyway) “the longer the input, the longer the output” because it was trained on sequences of varying lengths.

Thanks for highlighting the random nature of the train/test distributions in base 24. This could be part of the explanation for the good results indeed, but I’m still impressed by the accuracy.

If we try to better understand what is going on, we should keep in mind that relatively close integers with lots of digits have generally a small set of possible TST values, because of high merging probabilities (as already mentioned by @Fumblingnumbers ). In other words, the most significant digits are sufficient for a decent accuracy rate.

Example:
Take a random integer n=791693207994, with TST(n)=184. When computing TST values for n, n+1, …, n+100000, the value 184 occurs 49727 times. A random sampling reveals that the TST value 184 accounts for about 4% of the integers of the form 791693xxxxxx (among only 24 possible TST values or so) and 1% of all integers below 10^{12}.

This aggregation phenomenon is not related to the chosen base. So it would be relevant to use the same distributions as train/test datasets in base 2 as well to see what happens.

I can narrow these down further but if we consider the odd to odd movements, its easy to show my statement holds that ALL odd to odd increases do so sequentialy ×1.5 and that these merge on odd multiples of 3 sequentialy. ALL other odds decrease, we dont need to understand the system for decreasing to know they must either fall to 1,or fall to a point on the increasing system.Considering any integer within a loop can be considered a looping integer if you take s81 for example, if it formed a loop then so would s16,s24,s36,54 but this would not negate them returning to s81, but the loop could fall to s36 meaning s16 and s24 lead into the loop but do not form part of it.

you really leave your laptop on all day long to serve this website? lmk if you ever want a server to put it on! :laughing:

EDIT: or wait maybe you mean for development purposes…

1 Like

Haha, or maybe this can run in the cloud one day. My laptop has a lot of jobs, though, so I don’t think it minds one more. PS. Anybody who wants better Google indexing for this site, feel free link to forum.collatzworld.com from your place.

I would also suggest easier tasks to see what is feasible (or not) with a transformer:

  • RegEx recognition: try to detect binary strings matching a particular RegEx. Some simple examples could be ((10)^*(101)^*)^* for strings of the form 101010101101101010110 (where every two successive occurences of 0 are separated by either 1 or 11), or (10(0)^*)^* for strings with no two consecutive 1's, starting by 1 and ending by 0. This test seems particularly relevant for the 5 vs 16 task according to this post.
  • Modulo operations: try to learn modular arithmetic, like the computation of n \pmod 3 from the base-2 representation of n (that would be super easy in base 24 …). These congruence classes modulo 3 are not regular expressions, but they can be classified by a three-state automaton.

Good suggestion, especially when it’s time to look at extrapolation to larger instances than are in the training. I’m ignoring that for now – for example, taking the base-24 TST predictor trained on 100,000 long start numbers 1 to 10^{12} and applying it to the original test set of small start numbers between 80,001 and 100,000 gives an accuracy of 0\%.

For TST, I upped the training to one million start numbers between 1 and 10^{12}. For comparison, the previous result was:

  • 100k training start numbers and their TSTs, written in base-24.
  • Result: 41\% accuracy on train data, 10\% on test data
  • Example instances:
    – 2 8 1 15 13 9 0 15 19 | 13 13 | 7 16 | Wrong
    – 2 12 16 2 0 8 7 5 9 | 5 7 | 6 10 | Wrong
    – 5 15 16 22 3 6 12 6 2 | 7 22 | 7 22 | Right

With 10x training data, using the same test set, we get:

Epoch Loss Train Acc Test Acc
10 1.088 8.91% 9.64%
50 1.068 10.38% 10.81%
100 1.044 11.00% 11.11%
150 1.041 11.51% 11.84%
200 1.044 11.82% 11.58%
250 1.027 12.09% 11.91%
300 1.025 12.30% 12.30%

This time it doesn’t overfit, and the test accuracy steadily improves (and is still improving). The question is what is it learning? Some kind of interpolation?

I’ll ponder on this some more.

1 Like

Some other ML runs on Collatz-related tasks.

Compute n mod 3:

Base Examples Model Configuration Epochs Train Test
6 10k LSTM (2-layer, h=128) 50 100.00% 100.00%
Transformer (small) 20 99.65% 99.50%
2 100k LSTM (2-layer, h=128) 500 33.52% 33.45%
Transformer (small) 50 33.69% 33.51%
Transformer (large) 500 33.61% 33.17%

Can’t do n mod 3 on binary numbers. I thought the LSTM would have a fighting chance, since it works left-to-right, automata-like. But the ML systems seem to be on a wide flat plateau in which no small weight-change gets it any closer to action of the desired automaton.

Copy last 3 digits:

Base Examples Model Configuration Epochs Train Test
2 100k LSTM (2-layer, h=128) 50 98.25% 98.29%
Transformer (small) 20 95.27% 95.00%

Trivial task for debugging. Lightweight LSTM gets it faster and better.

Collatz Long Step:

Base Examples Model Configuration Epochs Train Test
24 100k LSTM (2-layer, h=128) 50 63.58% 54.57%
LSTM (2-layer, h=128) 300 73.15% 55.73%
LSTM (4-layer, h=128) 300 85.94% 70.23%
Transformer (small) 20 4.29% 4.23%
Transformer (large) 20 21.82% 21.70%
Transformer (4-layer, d=512) 20 67.35% 67.14%
Transformer (4-layer, d=512) 100 81.85% 79.48%

Replicating the 2025 arXiv paper. Lightweight LSTM can do the job.

Collatz 5-type vs 16-type:

Base Examples Model Configuration Epochs Train Test
6 80k LSTM (2-layer, h=128) 50 94.10% 93.71%
Transformer (small) 50 93.78% 94.00%
Transformer (large) 50 93.77% 94.00%

No better than chance.

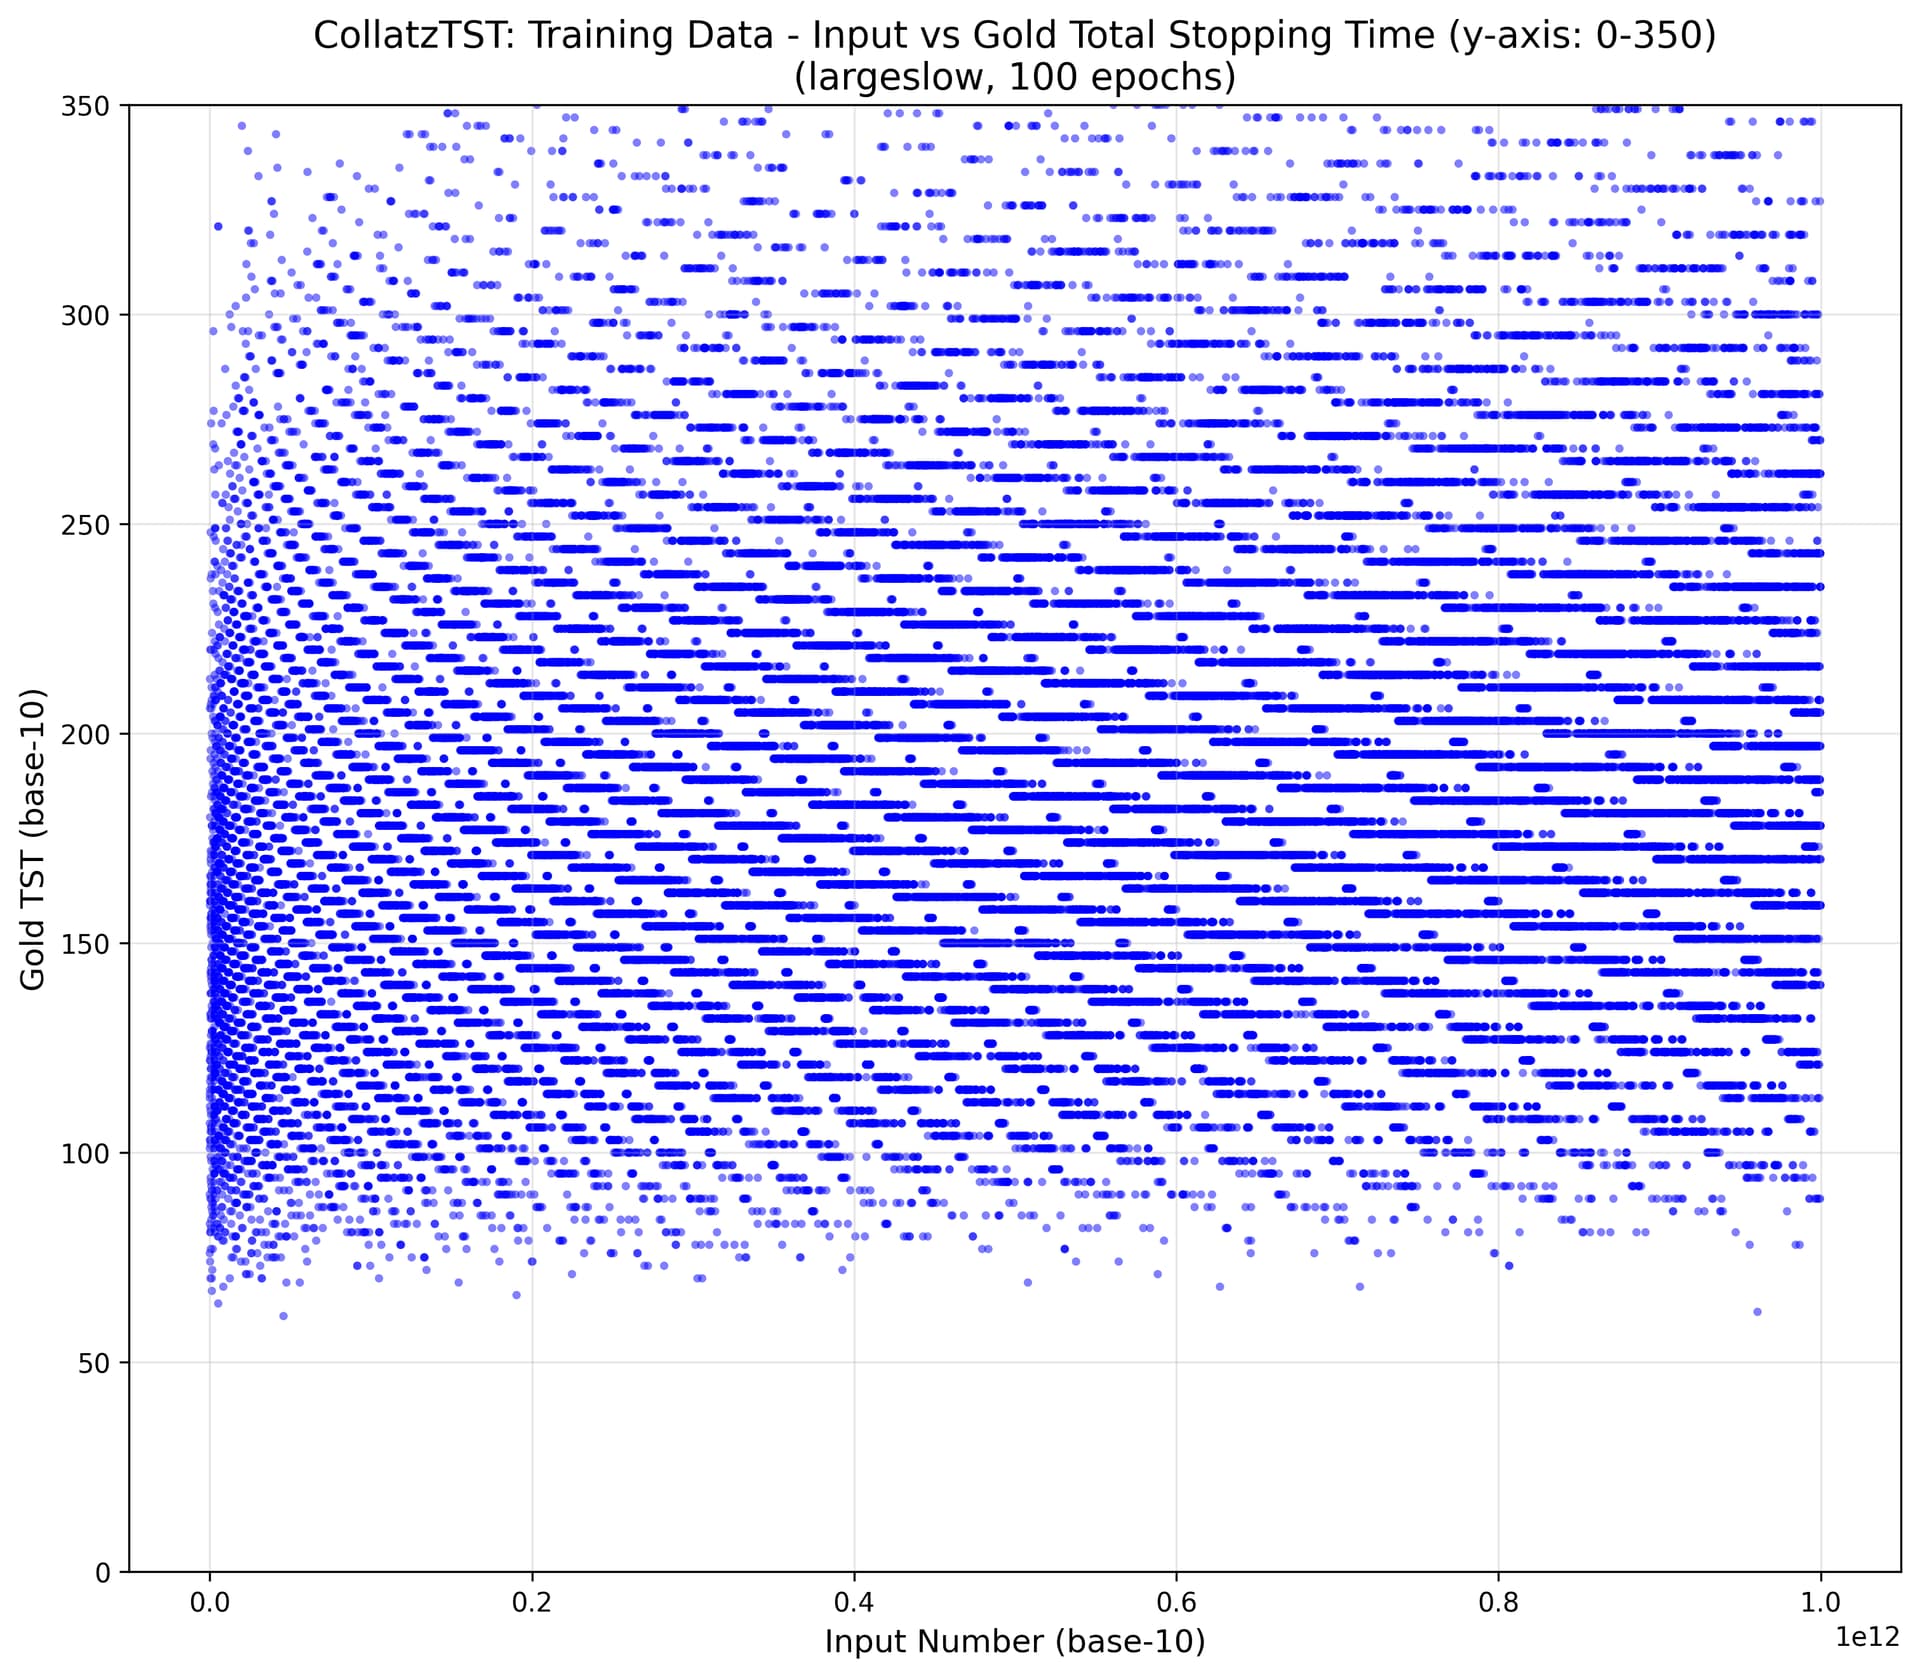
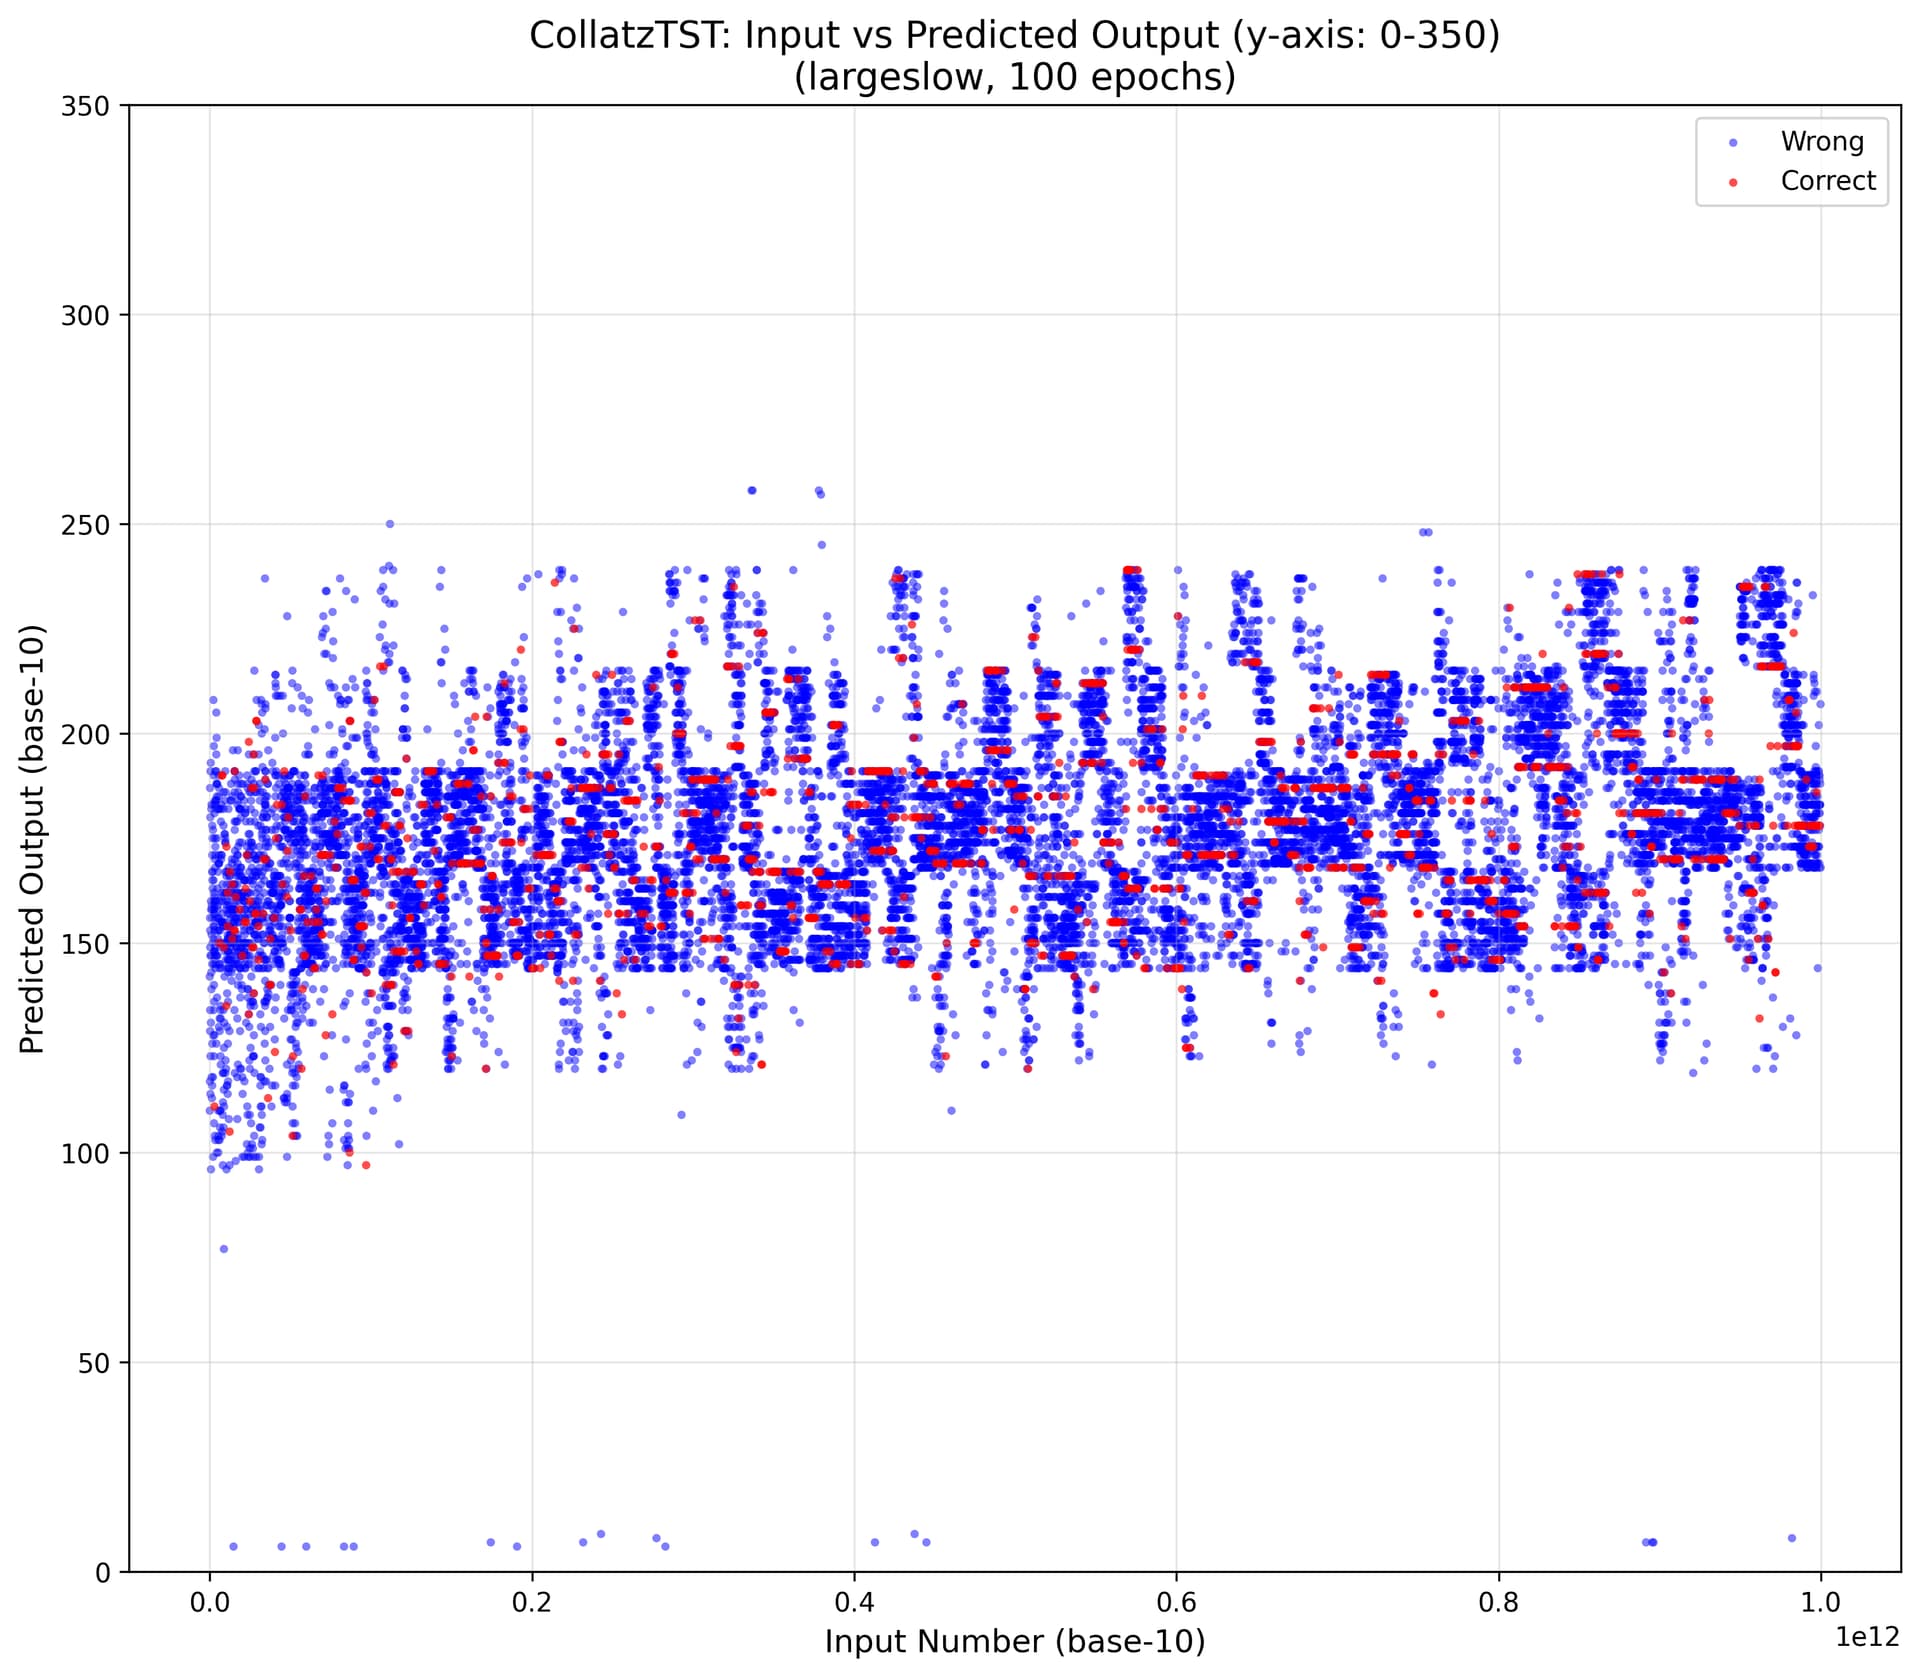
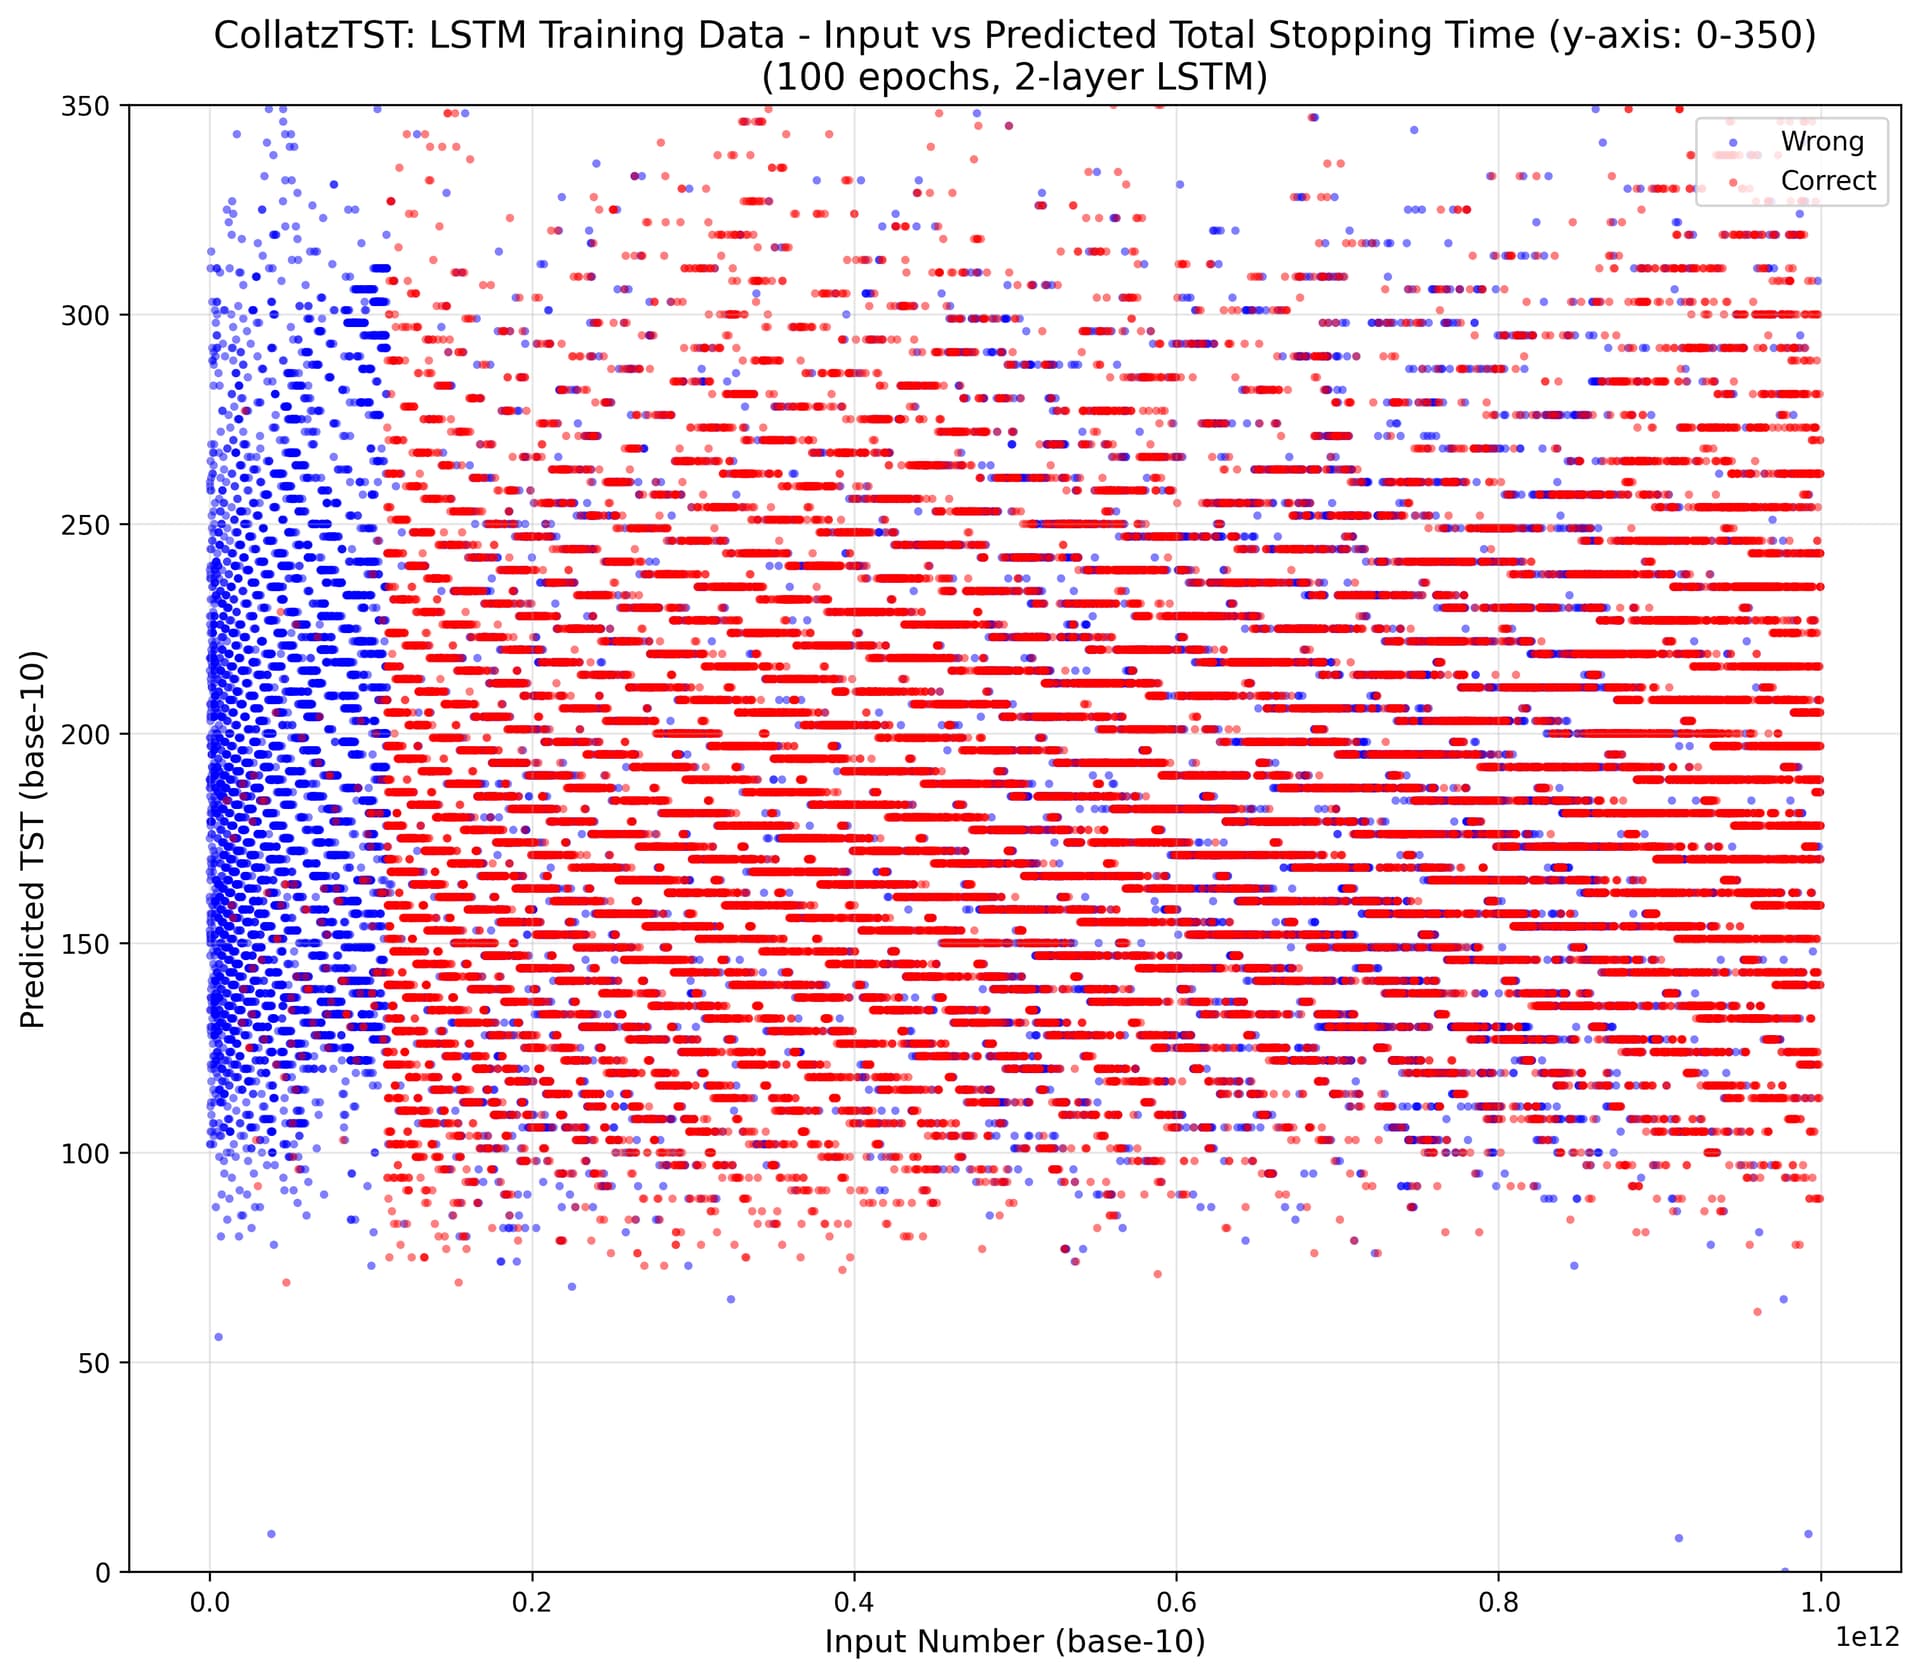
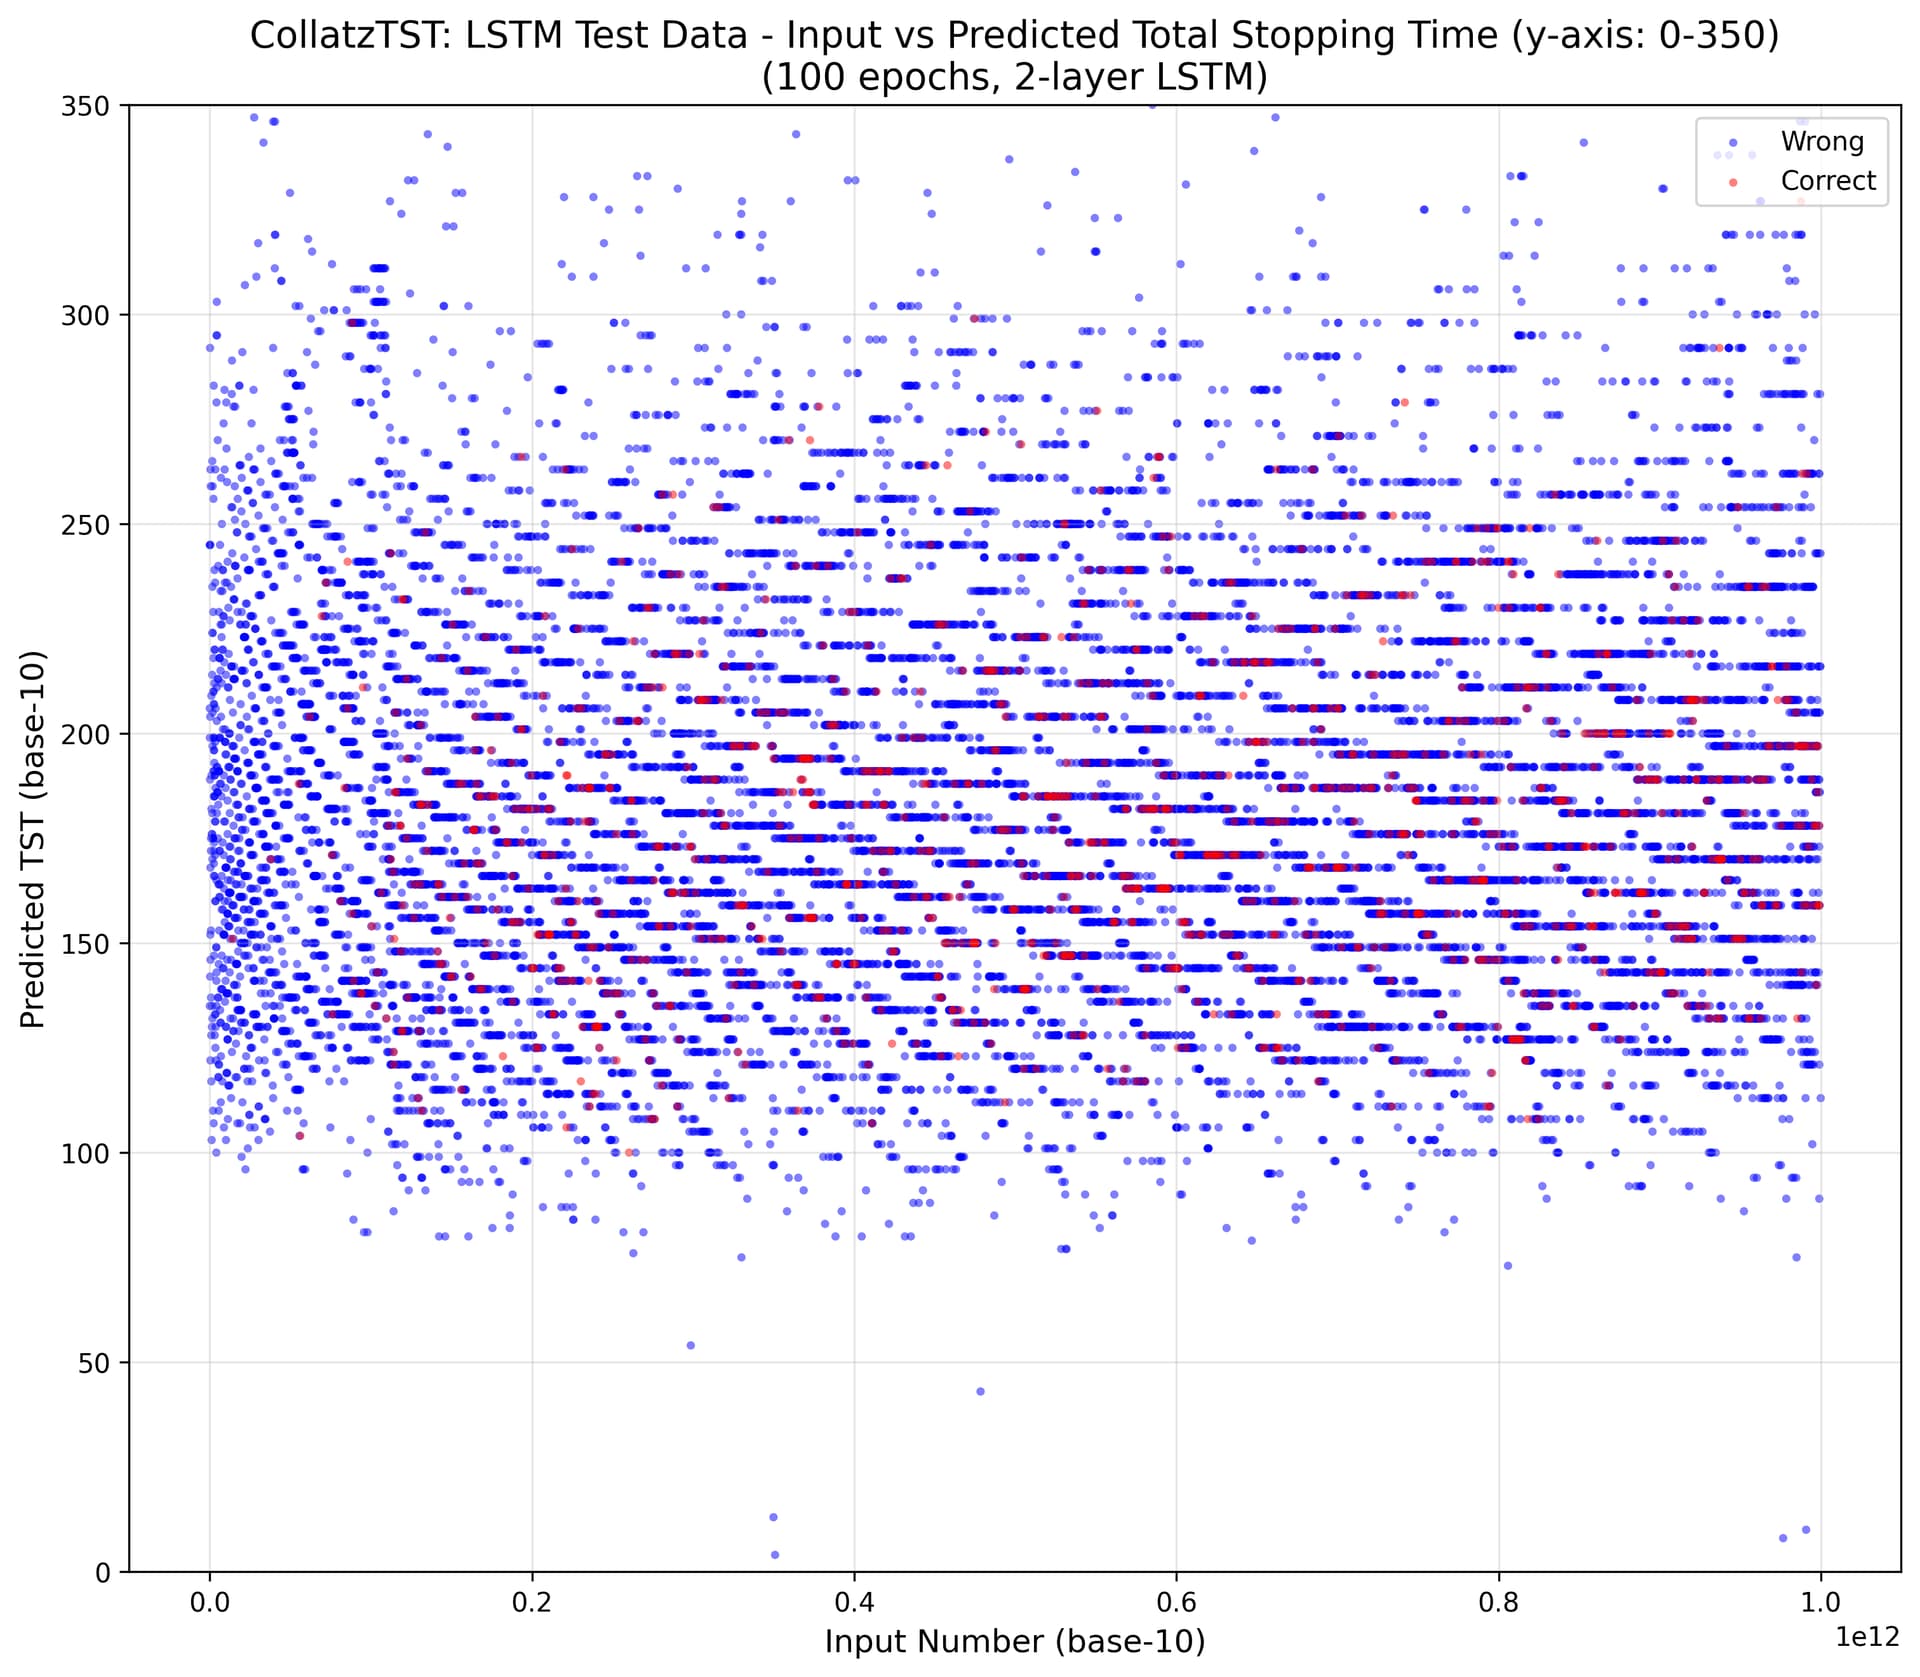
Collatz total stopping time (TST)

Base Examples Model Configuration Epochs Train Test
24 100k LSTM (2-layer, h=128) 100 53.06% 6.04%
Transformer (small) 100 7.89% 7.38%
Transformer (small) 500 8.84% 7.80%
Transformer (large) 100 10.95% 8.33%
Transformer (large) 400 22.01% 7.70%

The TST results are in the ballpark of previous runs, though some prior settings (and possibly gradient descent luck) did obtain 12.3\% test-set accuracy.

Regardless, all runs immediately jump to \approx 8\% accuracy on both train and test sets.

I’m kinda interested in what that 8\% is.

As @oros noted, even though the start numbers are drawn from 1 to 10^{12}, the TSTs are in a much smaller range. Their mean is 187 and stddev is 51.

The most common TST in the training data is 173 (in base 24, “7\ 5”). The baseline system “always guess 173” would only be correct in \frac{210}{20000} test cases, or 1.05\% accurate.

I wonder if there is some other simple baseline idea/program that would give 8\% test-set accuracy, or whether (by contrast) the ML system has learned something interesting.

The test set contains 336 unique TSTs, while the ML predictor (run on the same test set) yields a total 135 unique TSTs. The most frequently-output TSTs all begin with the base-24 digit 7, while the frequent gold answers are more diverse.

Postscript on predicting total stopping time (TST).

It seems to be picking up on general magnitude. If I scramble all the base-24 digits of the test start number, for both train and test, a newly-trained model gets 2.4\% test accuracy. If I scramble all but the leading digit, I get 4.4\% accuracy. Unscrambled, about 8\%.

Here’s a graph of the training data. Test numbers (x-axis) versus actual TSTs (y-axis). It looks kinda “nice”, but consider that n and n+1 may have wildly different TSTs, which makes prediction very hard. For example, what TST to predict for start number 53,822,996,543 (around the middle of the x-axis)?

Here’s a graph of the test data, which is naturally very similar.

Now here’s a graph of the TSTs that the model predicts for the test inputs. By the general upward slant, it seems to have learned “the bigger the input, the bigger the TST tends to be”. Outside of that, the predictor has some uhh interesting behaviors. The blocky squares are boundaries between predicting a leading base-24 digit of 4, 5, 6, 7, 8, or 9 (mostly 7s).

1 Like

One more postscript …

Some LSTM and transformer runs decide to overfit on the training data. Once down this path, they can classify training examples with 50\% accuracy (and rising), though test data accuracy remains at 6\% or so.

Here are a trained LSTM’s predictions on training data (red = correct, blue = wrong). So this thing gets the wavy pattern down.

However, the LSTM’s predictions on test data, while nice looking, aren’t too accurate.

Hot off the press: [2511.10811] Transformers know more than they can tell -- Learning the Collatz sequence

1 Like

I suggest to have a look at the probability density of the TST leading digit in base 24. Messy but not totally random. When zooming out, we can distinguish fuzzy patterns.

The same plot for the least significant digit is also interesting, with quite regular patterns that seem more or less predictable.

These nonuniform probability densities are likely sufficient to explain the observed accuracy (~8%) of TST predictions on the test dataset.

1 Like